

Question: what would the excel formula be for each question a-i? A major source of revenue in Texas is a state sales tax. One category of
what would the excel formula be for each question a-i?
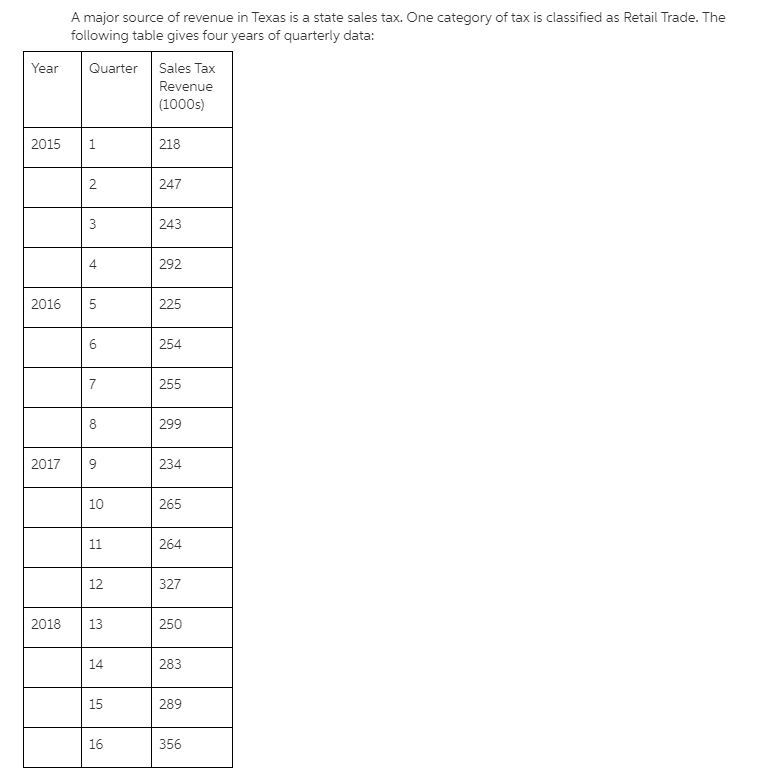
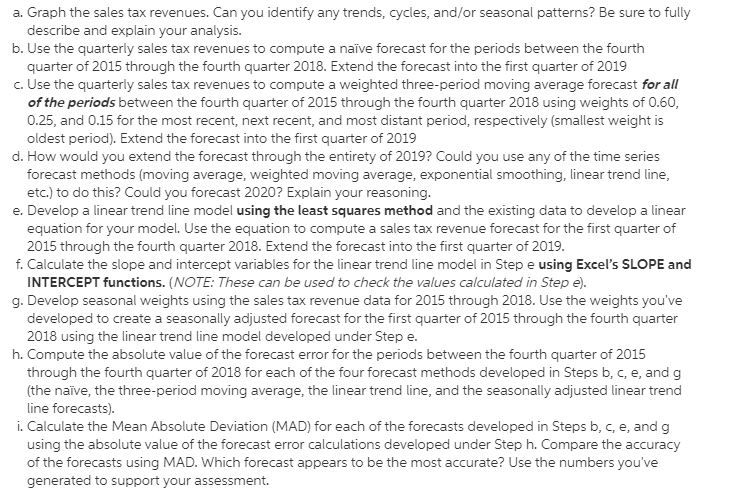
A major source of revenue in Texas is a state sales tax. One category of tax is classified as Retail Trade. The following table gives four years of quarterly data: Year Quarter Sales Tax Revenue (1000s) 2015 218 247 243 292 2016 225 254 255 299 2017 234 265 264 327 2018 250 283 289 356 a. Graph the sales tax revenues. Can you identify any trends, cycles, and/or seasonal patterns? Be sure to fully describe and explain your analysis. b. Use the quarterly sales tax revenues to compute a nave forecast for the periods between the fourth quarter of 2015 through the fourth quarter 2018. Extend the forecast into the first quarter of 2019 c. Use the quarterly sales tax revenues to compute a weighted three-period moving average forecast for all of the periods between the fourth quarter of 2015 through the fourth quarter 2018 using weights of 0.60, 0.25, and 0.15 for the most recent, next recent, and most distant period, respectively (smallest weight is oldest period). Extend the forecast into the first quarter of 2019 d. How would you extend the forecast through the entirety of 2019? Could you use any of the time series forecast methods (moving average, weighted moving average, exponential smoothing, linear trend line, etc.) to do this? Could you forecast 2020? Explain your reasoning. e. Develop a linear trend line model using the least squares method and the existing data to develop a linear equation for your model. Use the equation to compute a sales tax revenue forecast for the first quarter of 2015 through the fourth quarter 2018. Extend the forecast into the first quarter of 2019. f. Calculate the slope and intercept variables for the linear trend line model in Step e using Excel's SLOPE and INTERCEPT functions. (NOTE: These can be used to check the values calculated in Step e). g. Develop seasonal weights using the sales tax revenue data for 2015 through 2018. Use the weights you've developed to create a seasonally adjusted forecast for the first quarter of 2015 through the fourth quarter 2018 using the linear trend line model developed under Step e. h. Compute the absolute value of the forecast error for the periods between the fourth quarter of 2015 through the fourth quarter of 2018 for each of the four forecast methods developed in Steps b, c, e, and g (the naive, the three-period moving average, the linear trend line, and the seasonally adjusted linear trend line forecasts). i. Calculate the Mean Absolute Deviation (MAD) for each of the forecasts developed in Steps b, c, e, and g using the absolute value of the forecast error calculations developed under Step h. Compare the accuracy of the forecasts using MAD. Which forecast appears to be the most accurate? Use the numbers you've generated to support your assessment. A major source of revenue in Texas is a state sales tax. One category of tax is classified as Retail Trade. The following table gives four years of quarterly data: Year Quarter Sales Tax Revenue (1000s) 2015 218 247 243 292 2016 225 254 255 299 2017 234 265 264 327 2018 250 283 289 356 a. Graph the sales tax revenues. Can you identify any trends, cycles, and/or seasonal patterns? Be sure to fully describe and explain your analysis. b. Use the quarterly sales tax revenues to compute a nave forecast for the periods between the fourth quarter of 2015 through the fourth quarter 2018. Extend the forecast into the first quarter of 2019 c. Use the quarterly sales tax revenues to compute a weighted three-period moving average forecast for all of the periods between the fourth quarter of 2015 through the fourth quarter 2018 using weights of 0.60, 0.25, and 0.15 for the most recent, next recent, and most distant period, respectively (smallest weight is oldest period). Extend the forecast into the first quarter of 2019 d. How would you extend the forecast through the entirety of 2019? Could you use any of the time series forecast methods (moving average, weighted moving average, exponential smoothing, linear trend line, etc.) to do this? Could you forecast 2020? Explain your reasoning. e. Develop a linear trend line model using the least squares method and the existing data to develop a linear equation for your model. Use the equation to compute a sales tax revenue forecast for the first quarter of 2015 through the fourth quarter 2018. Extend the forecast into the first quarter of 2019. f. Calculate the slope and intercept variables for the linear trend line model in Step e using Excel's SLOPE and INTERCEPT functions. (NOTE: These can be used to check the values calculated in Step e). g. Develop seasonal weights using the sales tax revenue data for 2015 through 2018. Use the weights you've developed to create a seasonally adjusted forecast for the first quarter of 2015 through the fourth quarter 2018 using the linear trend line model developed under Step e. h. Compute the absolute value of the forecast error for the periods between the fourth quarter of 2015 through the fourth quarter of 2018 for each of the four forecast methods developed in Steps b, c, e, and g (the naive, the three-period moving average, the linear trend line, and the seasonally adjusted linear trend line forecasts). i. Calculate the Mean Absolute Deviation (MAD) for each of the forecasts developed in Steps b, c, e, and g using the absolute value of the forecast error calculations developed under Step h. Compare the accuracy of the forecasts using MAD. Which forecast appears to be the most accurate? Use the numbers you've generated to support your assessment
Step by Step Solution
There are 3 Steps involved in it

Get step-by-step solutions from verified subject matter experts