Answered step by step
Verified Expert Solution
Question
1 Approved Answer
When answering the questions make sure to submit Stata printout with the corre- sponding commands and outputs. Do citizens demand more democracy and political


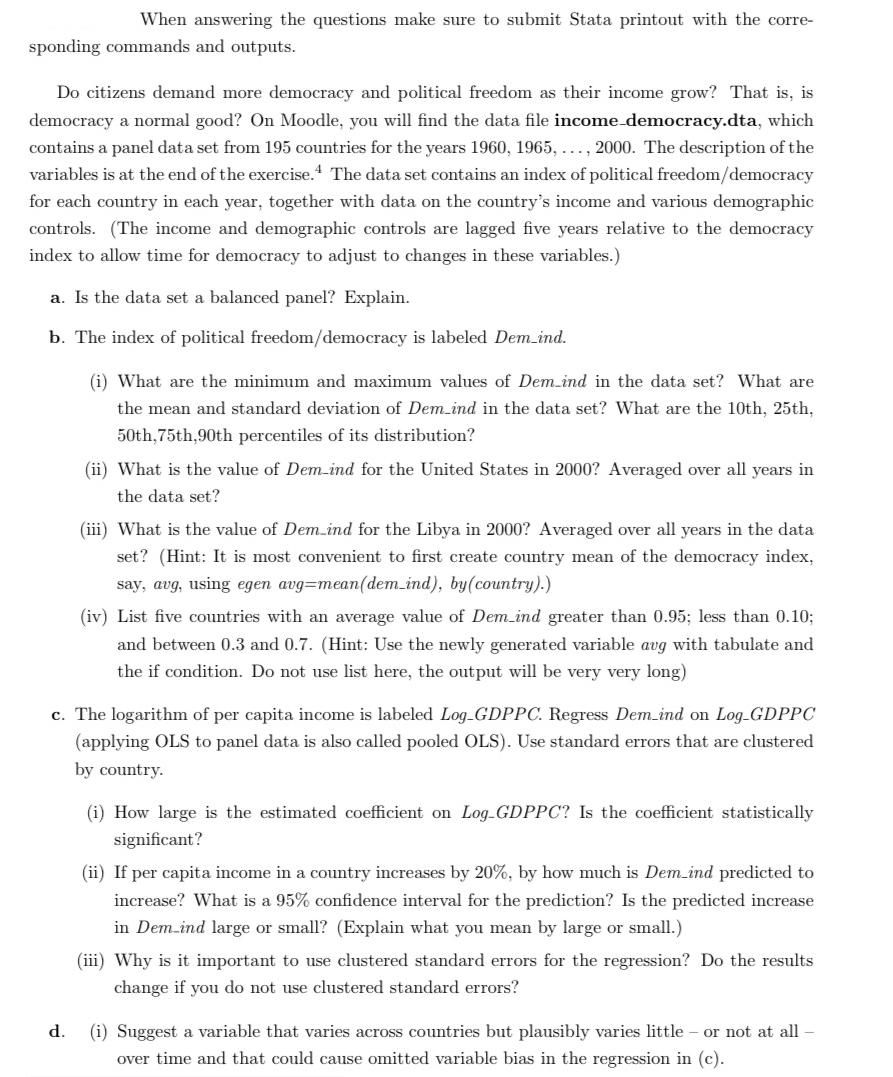
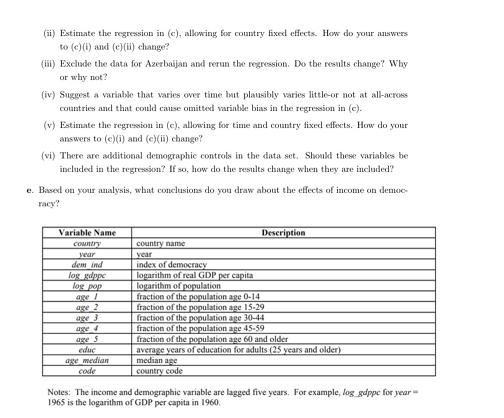
When answering the questions make sure to submit Stata printout with the corre- sponding commands and outputs. Do citizens demand more democracy and political freedom as their income grow? That is, is democracy a normal good? On Moodle, you will find the data file income-democracy.dta, which contains a panel data set from 195 countries for the years 1960, 1965, ..., 2000. The description of the variables is at the end of the exercise. The data set contains an index of political freedom/democracy for each country in each year, together with data on the country's income and various demographic controls. (The income and demographic controls are lagged five years relative to the democracy index to allow time for democracy to adjust to changes in these variables.) a. Is the data set a balanced panel? Explain. b. The index of political freedom/democracy is labeled Dem_ind. (i) What are the minimum and maximum values of Dem_ind in the data set? What are the mean and standard deviation of Dem_ind in the data set? What are the 10th, 25th, 50th, 75th,90th percentiles of its distribution? (ii) What is the value of Dem-ind for the United States in 2000? Averaged over all years in the data set? (iii) What is the value of Dem ind for the Libya in 2000? Averaged over all years in the data. set? (Hint: It is most convenient to first create country mean of the democracy index, say, avg, using egen avg=mean(dem_ind), by(country).) (iv) List five countries with an average value of Dem_ind greater than 0.95; less than 0.10; and between 0.3 and 0.7. (Hint: Use the newly generated variable avg with tabulate and the if condition. Do not use list here, the output will be very very long) c. The logarithm of per capita income is labeled Log GDPPC. Regress Dem_ind on Log-GDPPC (applying OLS to panel data is also called pooled OLS). Use standard errors that are clustered by country. d. (i) How large is the estimated coefficient on Log-GDPPC? Is the coefficient statistically significant? (ii) If per capita income in a country increases by 20%, by how much is Dem_ind predicted to increase? What is a 95% confidence interval for the prediction? Is the predicted increase in Dem_ind large or small? (Explain what you mean by large or small.) (iii) Why is it important to use clustered standard errors for the regression? Do the results change if you do not use clustered standard errors? (i) Suggest a variable that varies across countries but plausibly varies little or not at all over time and that could cause omitted variable bias in the regression in (c). (ii) Estimate the regression in (c), allowing for country fixed effects. How do your answers to (c)(i) and (e)(ii) change? (iii) Exclude the data for Azerbaijan and rerun the regression. Do the results change? Why or why not? (iv) Suggest a variable that varies over time but plausibly varies little-or not at all-across countries and that could cause omitted variable bias in the regression in (c). (v) Estimate the regression in (c), allowing for time and country fixed effects. How do your answers to (c)(i) and (e)(ii) change? (vi) There are additional demographic controls in the data set. Should these variables be included in the regression? If so, how do the results change when they are included? e. Based on your analysis, what conclusions do you draw about the effects of income on democ racy? Variable Name country year dem ind country name year Description log gdppe pop log age 1 age 2 age 3 age 4 age $ educ age median code index of democracy logarithm of real GDP per capita logarithm of population fraction of the population age 0-14 fraction of the population age 15-29 fraction of the population age 30-44 fraction of the population age 45-59 fraction of the population age 60 and older average years of education for adults (25 years and older) median age country code Notes: The income and demographic variable are lagged five years. For example, log_gdppe for year 1965 is the logarithm of GDP per capita in 1960.
Step by Step Solution
There are 3 Steps involved in it
Step: 1

Get Instant Access to Expert-Tailored Solutions
See step-by-step solutions with expert insights and AI powered tools for academic success
Step: 2

Step: 3

Ace Your Homework with AI
Get the answers you need in no time with our AI-driven, step-by-step assistance
Get Started


