

Answered step by step
Verified Expert Solution
Question
1 Approved Answer
When looking over the above scatter graphs GFT noticed an odd pattern in the data and wonderec whether their cost estimates would be reliable. The
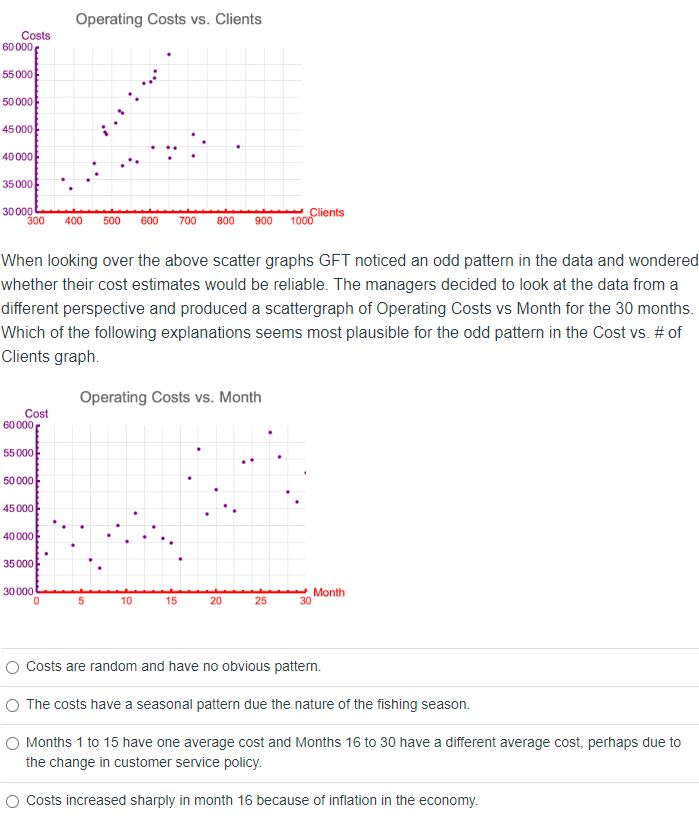 When looking over the above scatter graphs GFT noticed an odd pattern in the data and wonderec whether their cost estimates would be reliable. The managers decided to look at the data from a different perspective and produced a scattergraph of Operating Costs vs Month for the 30 months. Which of the following explanations seems most plausible for the odd pattern in the Cost vs. \# of Clients graph. Costs are random and have no obvious pattern. The costs have a seasonal pattern due the nature of the fishing season. Months 1 to 15 have one average cost and Months 16 to 30 have a different average cost, perhaps due to the change in customer service policy. Costs increased sharply in month 16 because of inflation in the economy
 Step by Step Solution
There are 3 Steps involved in it
Step: 1

Get Instant Access to Expert-Tailored Solutions
See step-by-step solutions with expert insights and AI powered tools for academic success
Step: 2

Step: 3
Ace Your Homework with AI
Get the answers you need in no time with our AI-driven, step-by-step assistance
Get Started
Financial Accounting 101 An Investment In Knowledge Pays The Best Interest Benjamin Franklin
Authors: Daniel Arellano
1st Edition
979-8633540260