

Question
when plotting an array of data Using MATLAB, I want the peaks to be labeld by their amplitude. How to do that? if it is
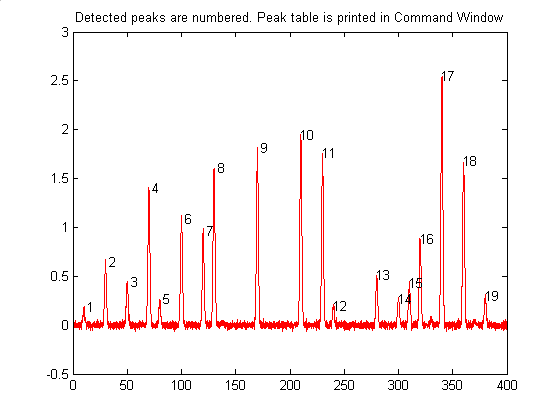
when plotting an array of data Using MATLAB, I want the peaks to be labeld by their amplitude. How to do that? if it is not possible how can I I label all the points plotted with their values? like this image there are numbers on the peak labled with numbers. However I want to lebel them with their actual values.
Step by Step Solution
There are 3 Steps involved in it
Step: 1

Get Instant Access to Expert-Tailored Solutions
See step-by-step solutions with expert insights and AI powered tools for academic success
Step: 2

Step: 3
Ace Your Homework with AI
Get the answers you need in no time with our AI-driven, step-by-step assistance
Get Started
Transactions And Database Dynamics 8th International Workshop On Foundations Of Models And Languages For Data And Objects Dagstuhl Castle Germany September 1999 Selected Papers Lncs 1773
Authors: Gunter Saake ,Kerstin Schwarz ,Can Turker
1st Edition
354067201X, 978-3540672012