Which company has the least amount of free cash flow?
Group of answer choices
Andrews
Ferris
Digby
Baldwin
Erie
Chester
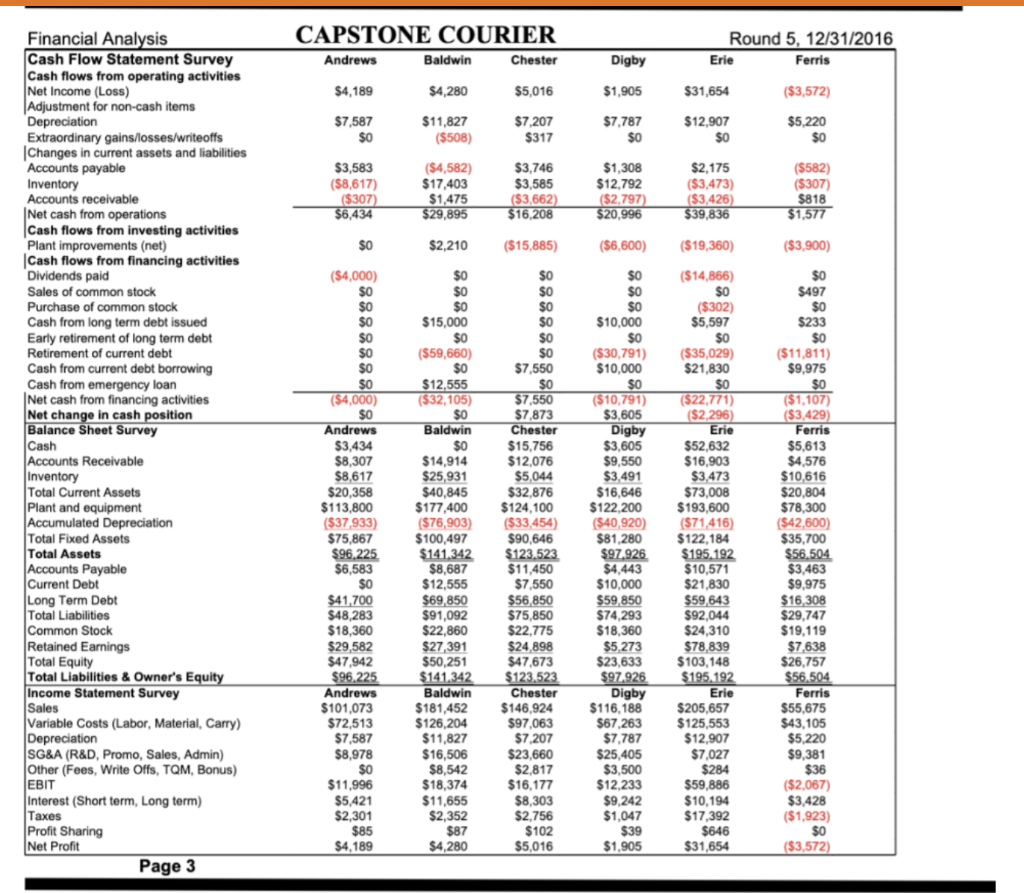
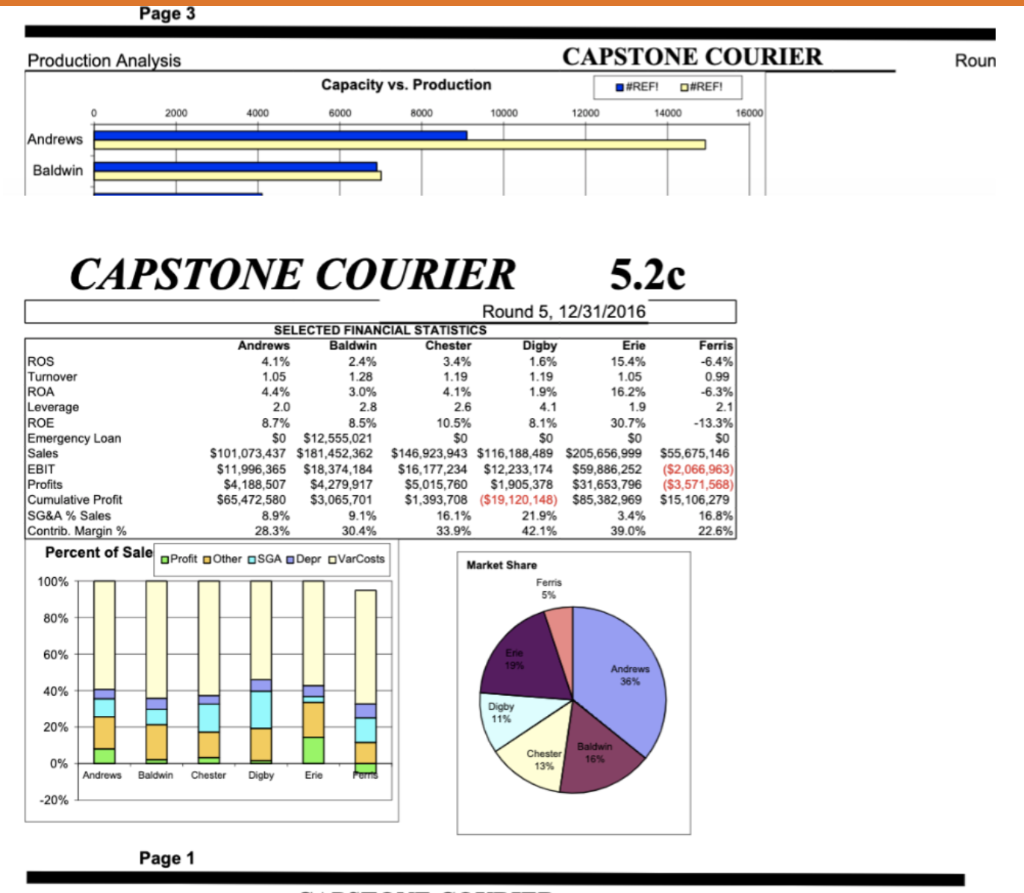
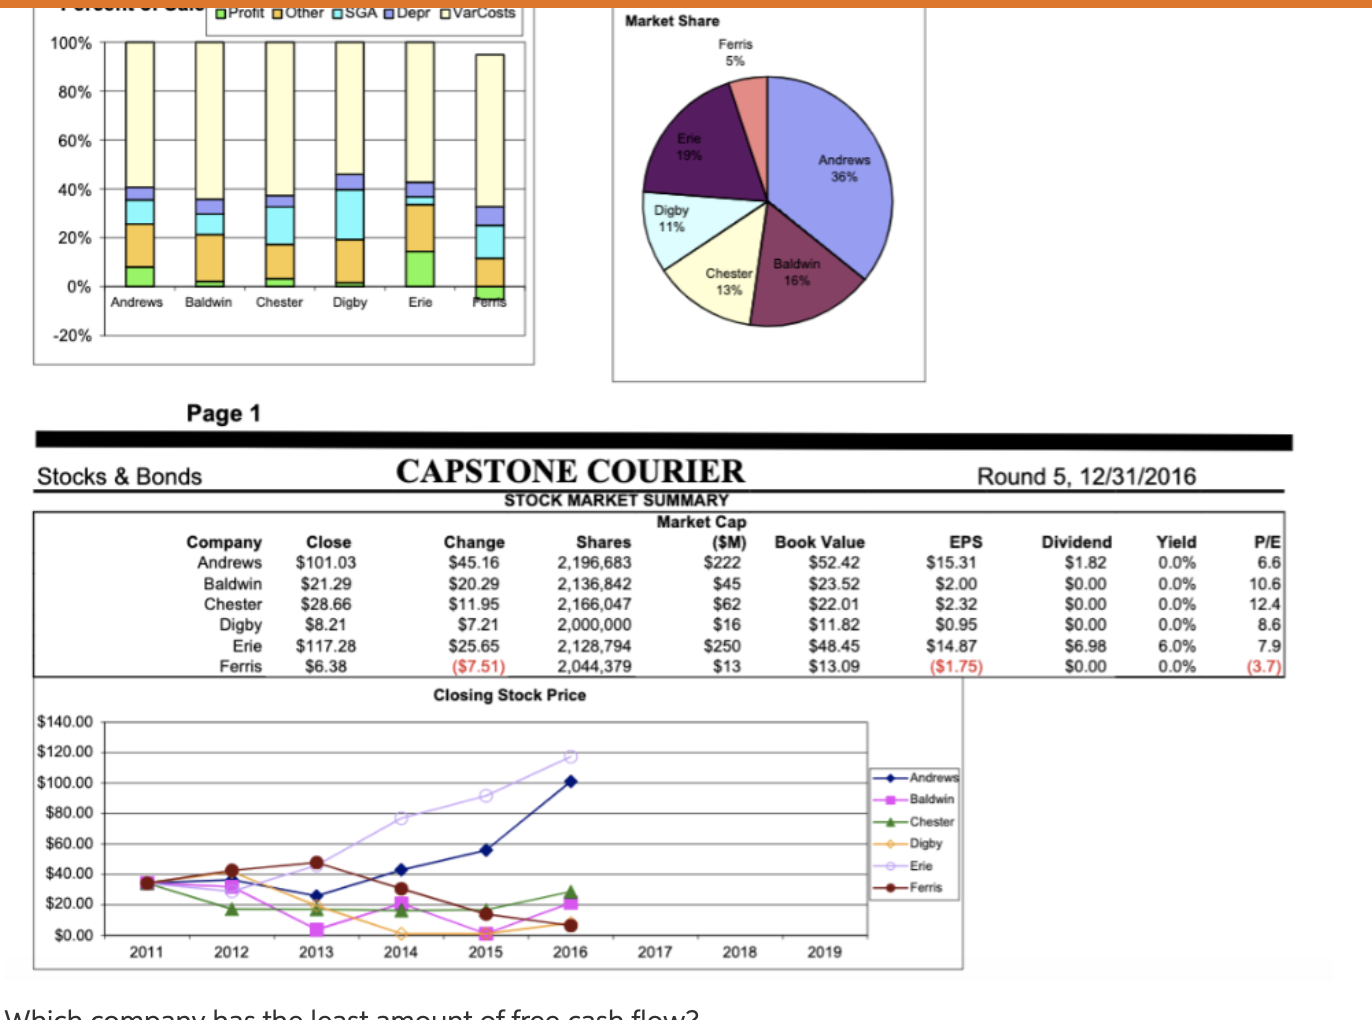
CAPSTONE COURIER Andrews Baldwin Chester Round 5, 12/31/2016 Erie Ferris Digby $4.189 $4,280 $5,016 $31,654 ($3,572) $1,905 $7,787 $7,587 $0 $11,827 ($508) $7,207 $317 $12,907 $0 $0 $5,220 $0 $3,583 ($8,617) ($307) $6,434 ($4,582) $17.403 $1,475 $29,895 $3,746 $3,585 ($3,662) $16.208 $1,308 $12,792 ($2,797) $20.996 $2,175 ($3,473) ($3,426) $39,836 (5582) ($307) $818 $1,577 $2,210 ($15,885) ($6,600) ($19,360) ($3,900) ($4,000) $0 $0 $497 $0 $15,000 ($14,866) $0 ($302) $5,597 $0 ($35,029) $21,830 SO $0 ($59,660) So $0 $0 ($4,000) $12,555 ($32,105) $0 Baldwin SO Financial Analysis Cash Flow Statement Survey Cash flows from operating activities Net Income (Loss) | Adjustment for non-cash items Depreciation Extraordinary gains/losses/writeoffs Changes in current assets and liabilities Accounts payable Inventory Accounts receivable Net cash from operations Cash flows from investing activities Plant improvements (net) Cash flows from financing activities Dividends paid Sales of common stock Purchase of common stock Cash from long term debt issued Early retirement of long term debt Retirement of current debt Cash from current debt borrowing Cash from emergency loan Net cash from financing activities Net change in cash position Balance Sheet Survey Cash Accounts Receivable Inventory Total Current Assets Plant and equipment Accumulated Depreciation Total Fixed Assets Total Assets Accounts Payable Current Debt Long Term Debt Total Liabilities Common Stock Retained Earnings Total Equity Total Liabilities & Owner's Equity Income Statement Survey Sales Variable Costs (Labor, Material, Carry) Depreciation SG&A (R&D, Promo, Sales, Admin) Other (Fees, Write Offs, TQM, Bonus) EBIT Interest (Short term, Long term) Taxes Profit Sharing Net Profit Page 3 $0 Andrews $3,434 $8,307 $8,617 $20,358 $113,800 ($37.933) $75,867 $96,225 $6,583 $0 $41,700 $48,283 $18,360 $29,582 $47,942 $96.225 Andrews $101,073 $72,513 $7,587 $8,978 $0 $11.996 $5,421 $2,301 $85 $4,189 $14,914 $25,931 $40,845 $177,400 ($76,903) $100,497 $141.342 $8,687 $12,555 $69,850 $91,092 $22,860 $27,391 $50,251 $141.342 Baldwin $181,452 $126,204 $11,827 $16,506 $8,542 $18,374 $11,655 $2,352 $87 $4,280 $7,550 $0 $7,550 $7,873 Chester $15.756 $12,076 $5,044 $32,876 $124,100 ($33,454) $90,646 $123,523 $11,450 $7,550 $56,850 $75,850 $22,775 $24,898 $47,673 $123.523 Chester $146,924 $97,063 $7.207 $23,660 $2,817 $16,177 $8,303 $2,756 $102 $5,016 $10,000 $0 ($30,791) $10,000 $0 ($10,791) $3,605 Digby $3,605 $9,550 $3,491 $16,646 $122,200 ($40,920) $81,280 $97.926 $4,443 $10,000 $59,850 $74,293 $18,360 $5,273 $23,633 $97.926 Digby $116,188 $67,263 $7,787 $25,405 $3,500 $12,233 $9,242 $1,047 ($22,771) ($2,296) Erie $52,632 $16,903 $3,473 $73,008 $193,600 ($71,416) $122,184 $195,192 $10,571 $21,830 $59,643 $92,044 $24,310 $78,839 $103,148 $195.192 Erie $205,657 $125,553 $12,907 $7,027 $284 $59,886 $10,194 $17,392 $646 $31,654 $233 $0 ($11,811) $9,975 $0 ($1,107) ($3,429) Ferris $5,613 $4,576 $10,616 $20,804 $78,300 ($42,600) $35,700 $56.504 $3,463 $9,975 $16,308 $29,747 $19,119 $7,638 $26,757 $56.504 Ferris $55,675 $43,105 $5,220 $9,381 $36 ($2,067) $3,428 ($1,923) $0 ($3,572) $39 $1,905 Page 3 Production Analysis Roun Capacity vs. Production 6000 8000 10000 CAPSTONE COURIER #REF! #REF! 12000 14000 2000 4000 Andrews Baldwin CAPSTONE COURIER Rad Ferris -6.4% 0.99 -6.3% 2.1 -13.3% $0 SO Round 5, 12/31/2016 SELECTED FINANCIAL STATISTICS Andrews Baldwin Chester Digby Erie ROS 4.1% 2.4% 3.4% 1.6% 15.4% Turnover 1.05 1.28 1.19 1.19 1.05 ROA 4.4% 3.0% 4.1% 1.9% 16.2% Leverage 2.0 2.8 2.6 4.1 1.9 ROE 8.7% 8.5% 10.5% 8.1% 30.7% Emergency Loan $0 $12,555,021 $0 $o Sales $101,073,437 $181,452,362 $146.923,943 $116,188,489 $205,656,999 EBIT $11,996,365 $18,374,184 $16,177,234 $12,233,174 $59,886,252 Profits $4,188,507 $4,279,917 $5,015,760 $1,905,378 $31,653,796 Cumulative Profit $65,472,580 $3,065,701 $1,393,708 ($19,120,148) $85,382,969 SG&A % Sales 8.9% 9.1% 16.1% 21.9% 3.4% Contrib. Margin % 28.3% 30.4% 33.9% 42.1% 39.0% Percent of Sale Profit Other OSGA Depr VarCosts Market Share 100% Ferris $55,675,146 ($2,066,963) ($3,571,568) $15, 106,279 16.8% 22.6% 5% 80% 60% Andrews 40% Digby 11% Baldwin 16% 0 Chester 13% % Andrews Baldwin Chester Digby Erie -20% Page 1 Profit Other OSGA Depr VarCosts 100% Market Share Ferris 59 80% 60% Ene 19% Andrews 36% 40% Digby 11% 20% Baldwin Chester16 Chester 13% 0% Andrews Baldwin Chester Digby Erie 20% Page 1 Stocks & Bonds Round 5. 12/31/2016 Yield P/E 6.6 Company Andrews Baldwin Chester Digby Erie Ferris 10.6 CAPSTONE COURIER STOCK MARKET SUMMARY Market Cap Change Shares ($M) $45.16 2,196,683 $222 $20.29 2,136,842 $45 $11.95 2,166,047 $62 $7.21 2,000,000 $16 $25.65 2,128,794 $250 ($7.51) 2,044,379 $13 Closing Stock Price Close $101.03 $21.29 $28.66 $8.21 $117.28 $6.38 Book Value $52.42 $23.52 $22.01 $11.82 $48.45 $13.09 EPS $15.31 $2.00 $2.32 $0.95 $14.87 ($1.75) Dividend $1.82 $0.00 $0.00 $0.00 $6.98 $0.00 0.0% 0.0% 0.0% 0.0% 6.0% 0.0% 12.4 8.6 7.9 $140.00 $120.00 $100.00 $80.00 $60.00 $40.00 $20.00 $0.00 -Andrews Baldwin Chester Digby Erie Ferris - 2011 2012 2013 2014 2014 2015 2016 2017 2018 2019 Walbicb com b atheloact amount of froncoch fler