

Answered step by step
Verified Expert Solution
Question
1 Approved Answer
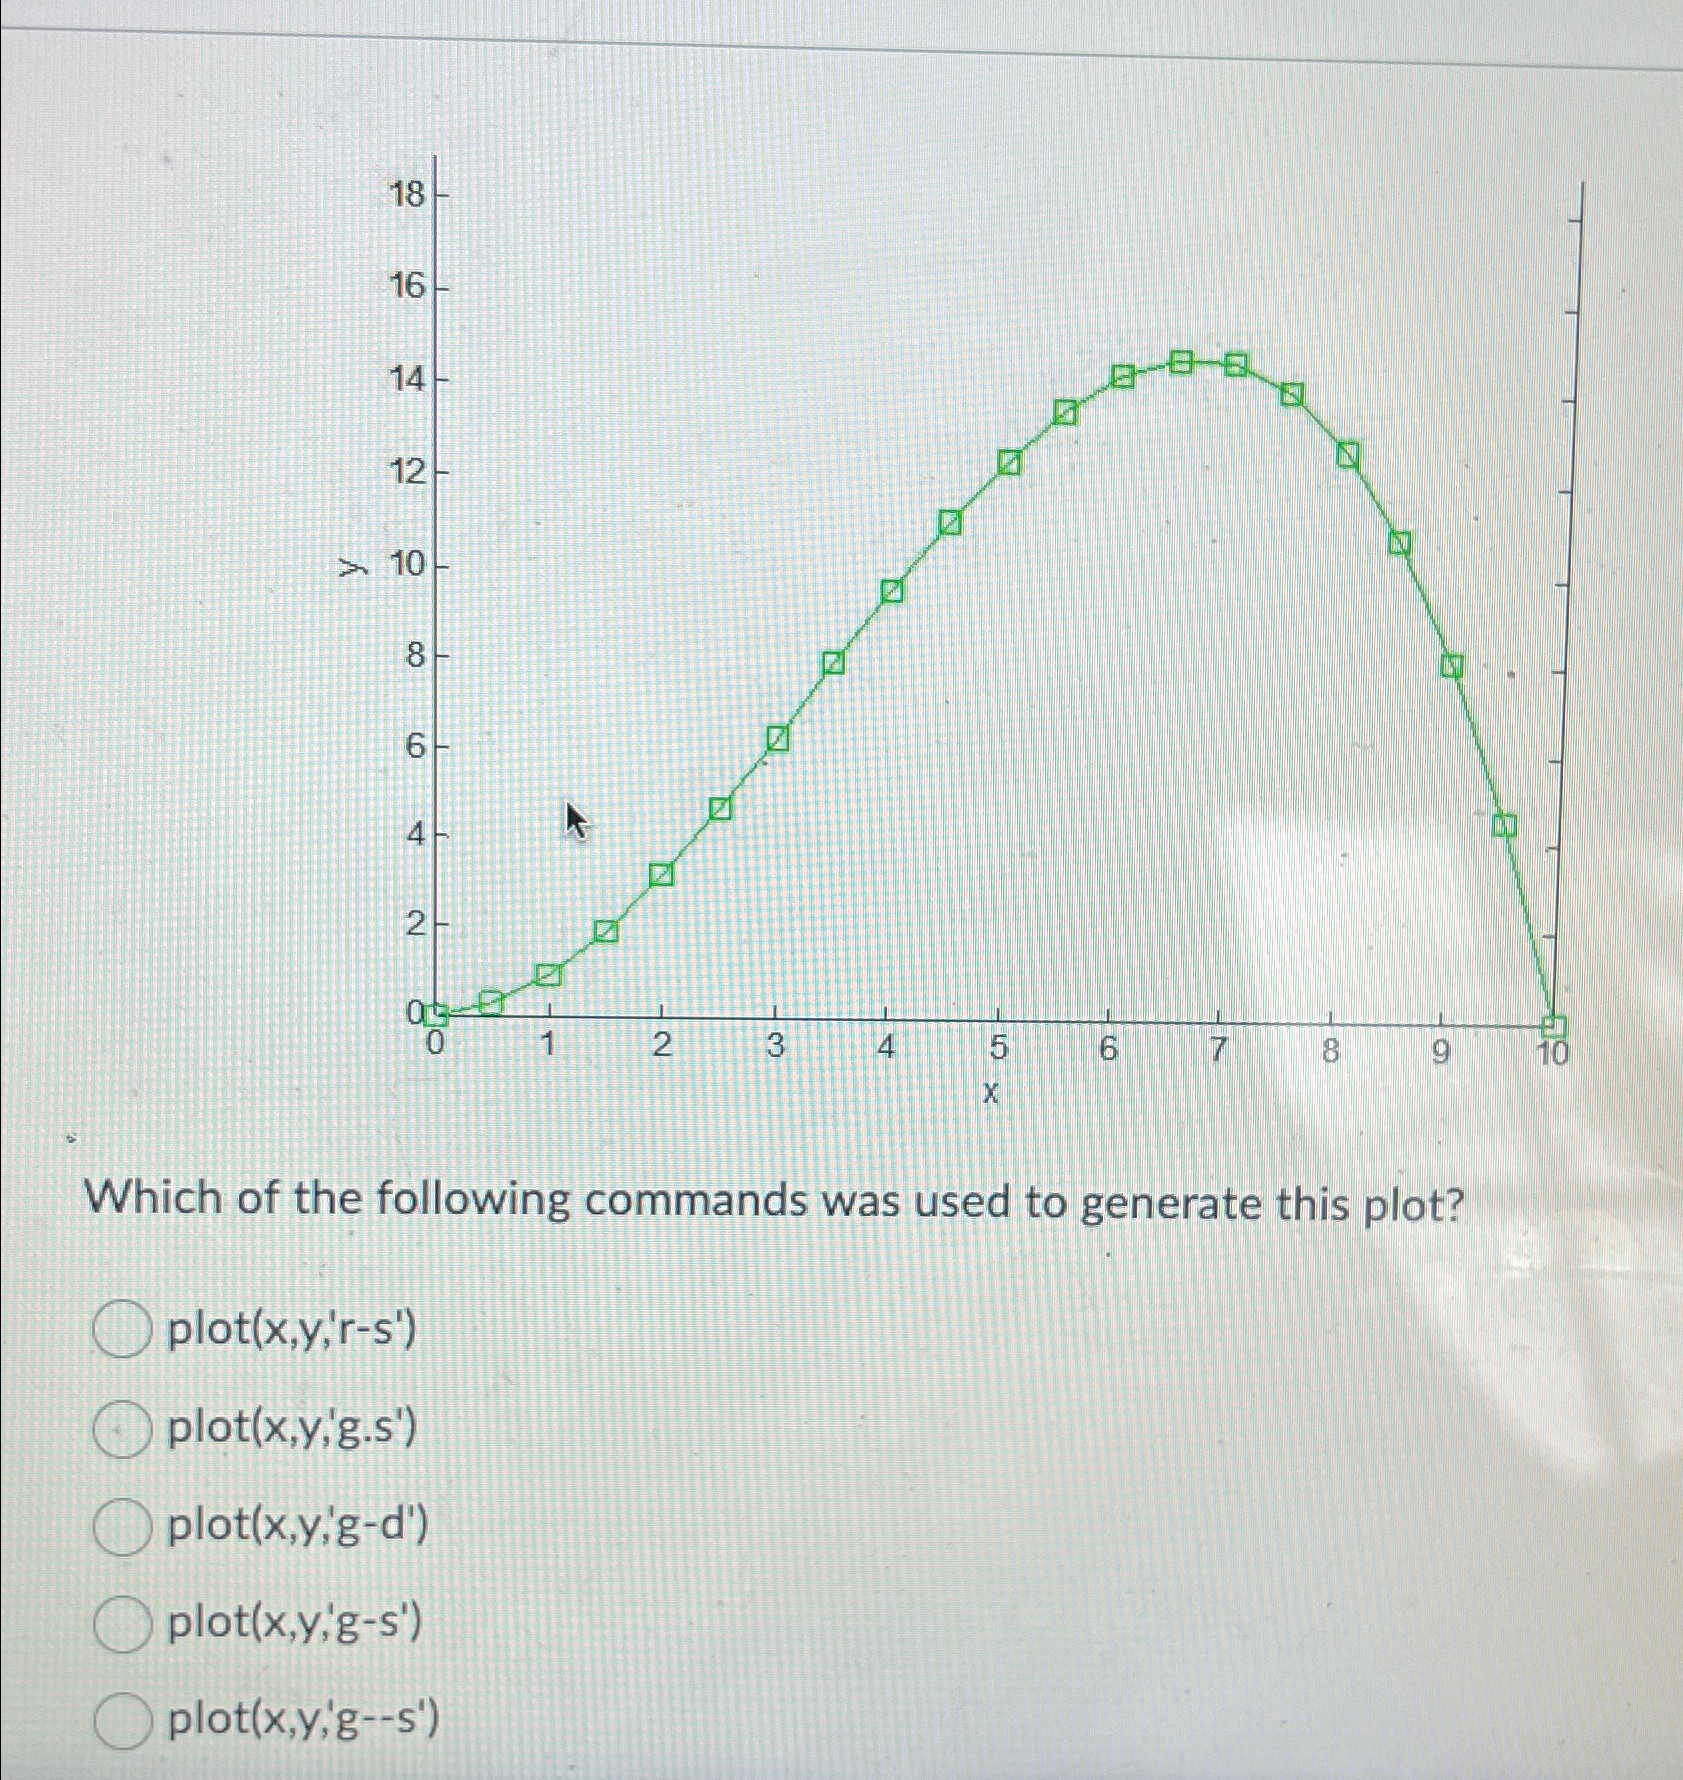
Which of the following commands was used to generate this plot? plot ( x , y , ' r - s ' ) plot (
Which of the following commands was used to generate this plot?
plotxyrs
plotxygs
plotxygd
plotxygs
plot:
Step by Step Solution
There are 3 Steps involved in it
Step: 1

Get Instant Access to Expert-Tailored Solutions
See step-by-step solutions with expert insights and AI powered tools for academic success
Step: 2

Step: 3
Ace Your Homework with AI
Get the answers you need in no time with our AI-driven, step-by-step assistance
Get Started
Practical Database Auditing For Microsoft SQL Server And Azure SQL Troubleshooting Regulatory Compliance And Governance
Authors: Josephine Bush
1st Edition
1484286332, 978-1484286333