

Answered step by step
Verified Expert Solution
Question
1 Approved Answer
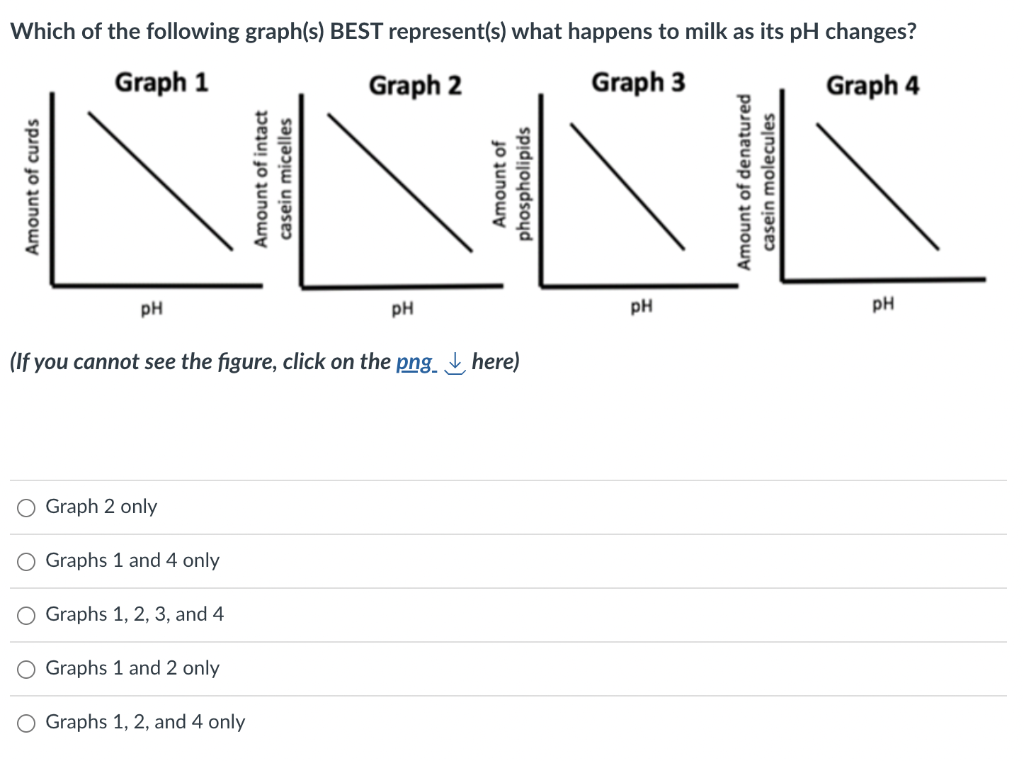
Which of the following graph(s) BEST represent(s) what happens to milk as its pH changes? (If you cannot see the figure, click on the png.
Step by Step Solution
There are 3 Steps involved in it
Step: 1

Get Instant Access to Expert-Tailored Solutions
See step-by-step solutions with expert insights and AI powered tools for academic success
Step: 2

Step: 3
Ace Your Homework with AI
Get the answers you need in no time with our AI-driven, step-by-step assistance
Get Started
Physical Chemistry
Authors: Peter Atkins
7th Edition
978-0716735397, 716735393, 978-0716743880