Which of the following is true of the chart provided: Food Sales via Delivery Apps May 1, 2018 - May 31, 2019 100 - Chipotle
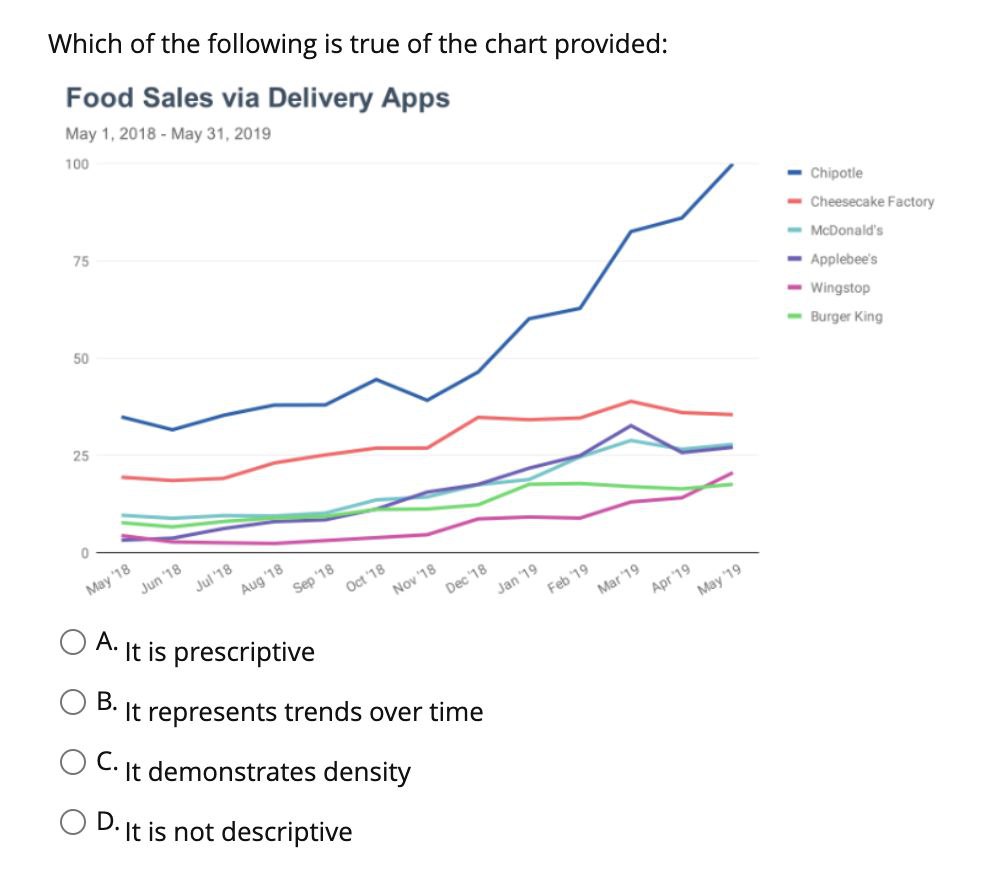
Which of the following is true of the chart provided: Food Sales via Delivery Apps May 1, 2018 - May 31, 2019 100 - Chipotle - Cheesecake Factory - Mcdonald's 75 Applebee's - Wingstop -Burger King 50 25 May '18 Jun 18 Jul '18 Aug '18 Sep '18 Oct 18 Nov '18 Dec '18 Jan 19 Feb 19 Mar 19 Apr 19 May 19 O A. It is prescriptive O B. It represents trends over time O C. It demonstrates density O D. It is not descriptive
Step by Step Solution
There are 3 Steps involved in it
Step: 1
Get Instant Access to Expert-Tailored Solutions
See step-by-step solutions with expert insights and AI powered tools for academic success
Step: 2
Step: 3
Ace Your Homework with AI
Get the answers you need in no time with our AI-driven, step-by-step assistance