Answered step by step
Verified Expert Solution
Question
1 Approved Answer
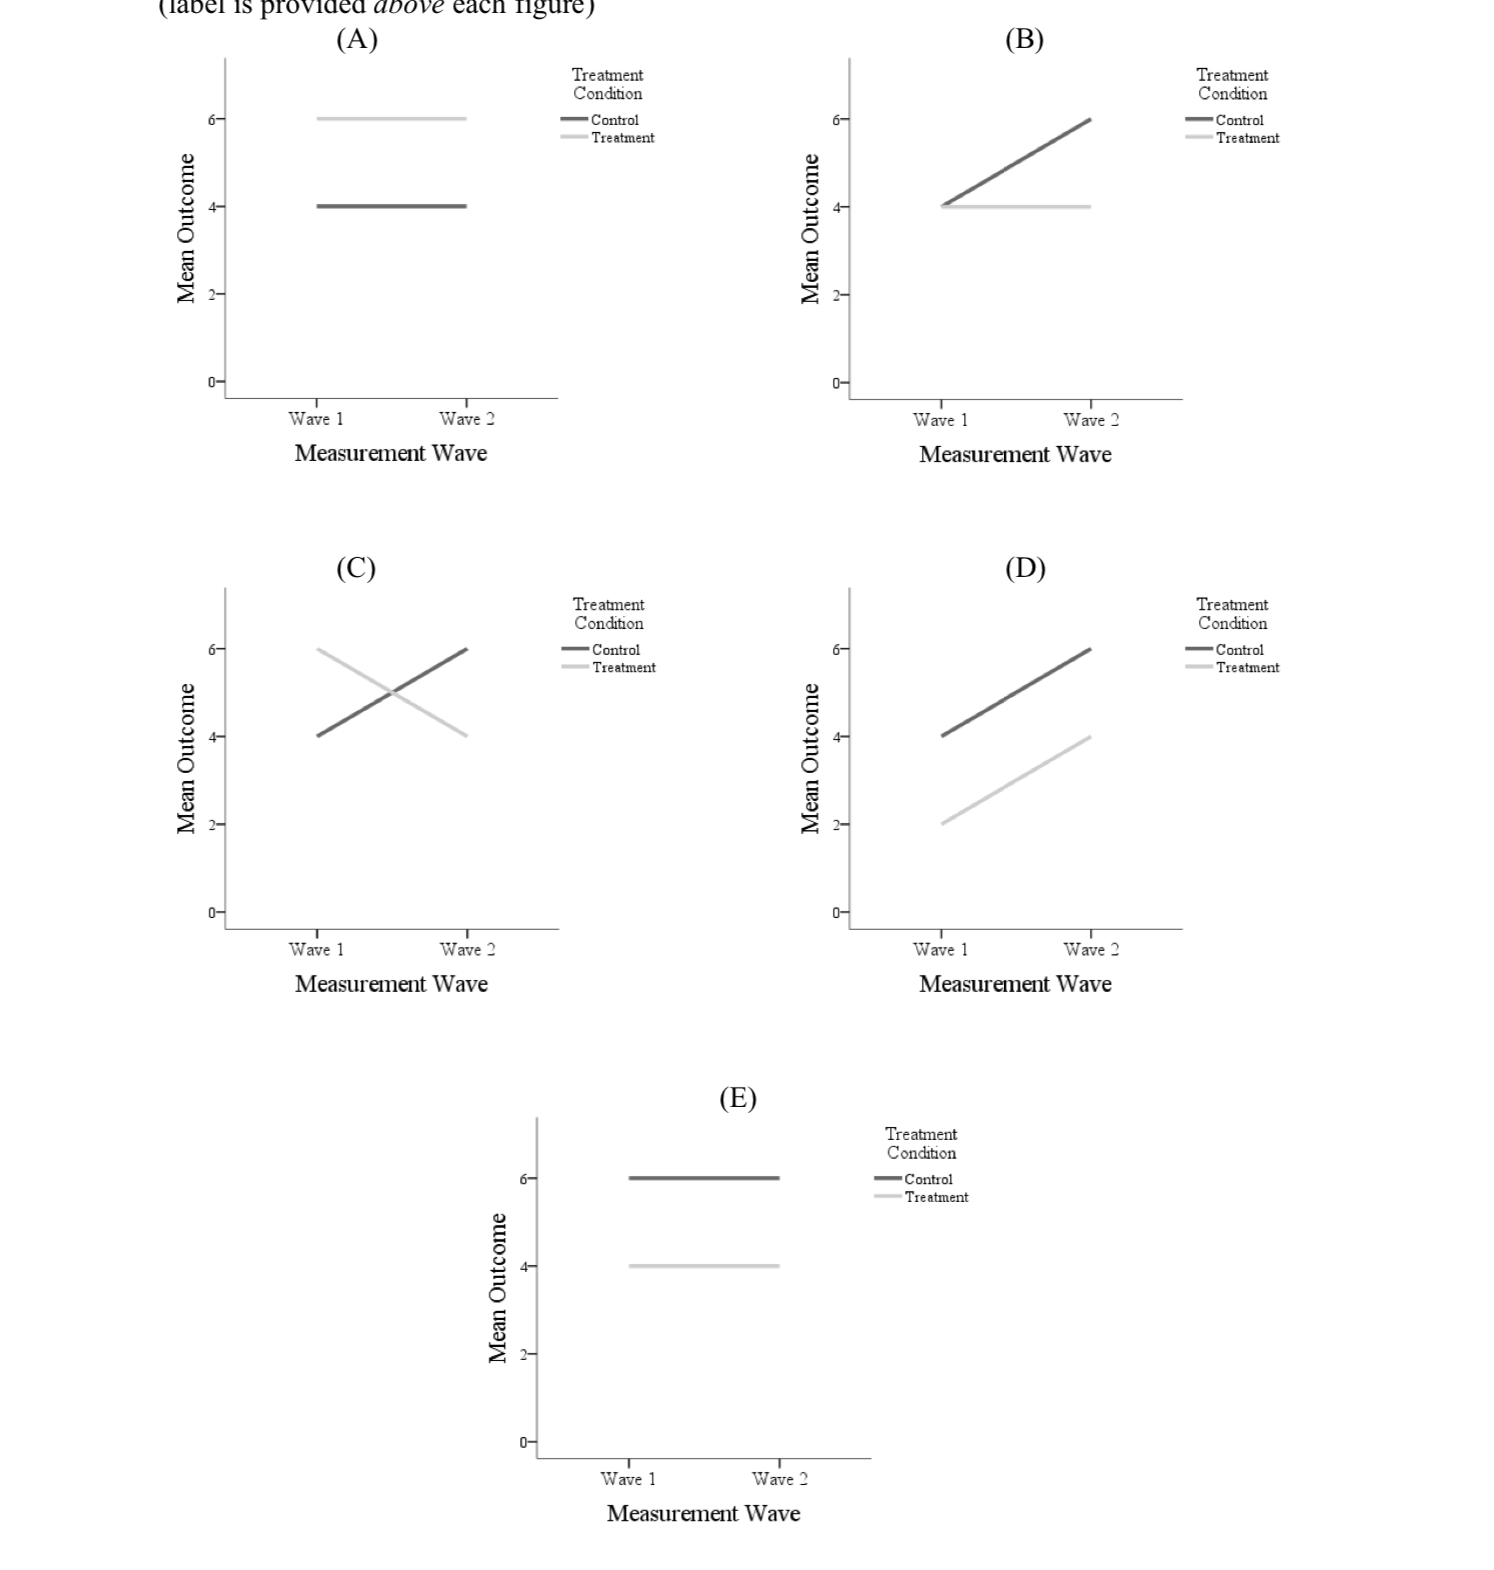
Which of the graphs displays means that are consistent with the analysis finding a: 1) main effect of Time , 2) a main effect of
Which of the graphs displays means that are consistent with the analysis finding a:
1) maineffect of Time,
2) amaineffect of TrtGroup, but
3) anon-significant interaction
A. Figure A
B. Figure B
C. Figure C
D. Figure D
E. Figure E
F. Two figures show this pattern of effects

Step by Step Solution
There are 3 Steps involved in it
Step: 1

Get Instant Access to Expert-Tailored Solutions
See step-by-step solutions with expert insights and AI powered tools for academic success
Step: 2

Step: 3

Ace Your Homework with AI
Get the answers you need in no time with our AI-driven, step-by-step assistance
Get Started


