Question
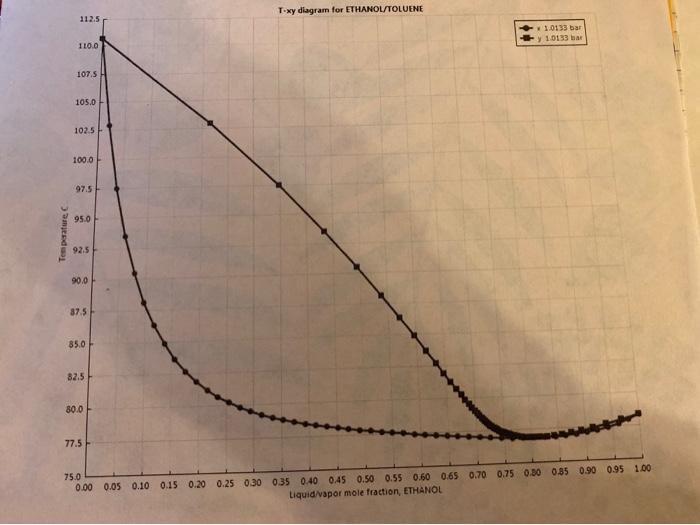
The diagram shows equilibrium data for a binary mixture. The coordinates of the given points are xD = [0.95,0.95]; A = [0.30,0.50]; B = [0.0,
The diagram shows equilibrium data for a binary mixture. The coordinates of the given points are xD = [0.95,0.95]; A = [0.30,0.50]; B = [0.0, 0.80]; C = [0.10, 1.0]
If the x-coordinate of point D = 0.82. what is the value of the y-coordinate?
ii. What is the value of when the mixture consists almost entirely of the more volatile component?
iii. What is the value of when the mixture consists almost entirely of the less volatile component?
If the line from A to xD is the top operating line of a column,
iv. What is the distillate composition?
v. What, approximately, is the liquid composition leaving the top tray?
Chemical &
Biological
Engineering.
1
2
vi. What do you estimate to be the vapors composition reaching the top tray?
vii. What is the reflux ratio in this column?

Temperature, C T-xy diagram for ETHANOL/TOLUENE 112.5 1.0133 bar y 1.0133 bar 110.0 107.5 105.0 102.5 100.0 97.5 95.0 92.5 90.0 37.5 85.0 82.5 80.0 77.5H 75.0 0.00 0.05 0.10 0.15 0.20 0.25 0.30 0.35 0.40 0.45 0.50 0.55 0.60 0.65 0.70 0.75 0.30 0.85 0.90 0.95 1.00 Liquid/vapor mole fraction, ETHANOL
Step by Step Solution
3.43 Rating (159 Votes )
There are 3 Steps involved in it
Step: 1
To address each question i Since point D has xcoordinate 082 and lies on the equilibrium curve we in...
Get Instant Access to Expert-Tailored Solutions
See step-by-step solutions with expert insights and AI powered tools for academic success
Step: 2

Step: 3

Ace Your Homework with AI
Get the answers you need in no time with our AI-driven, step-by-step assistance
Get Started


