***WILL DEFINITELY GIVE A THUMBS UP IF DONE NICELY*** Thank you

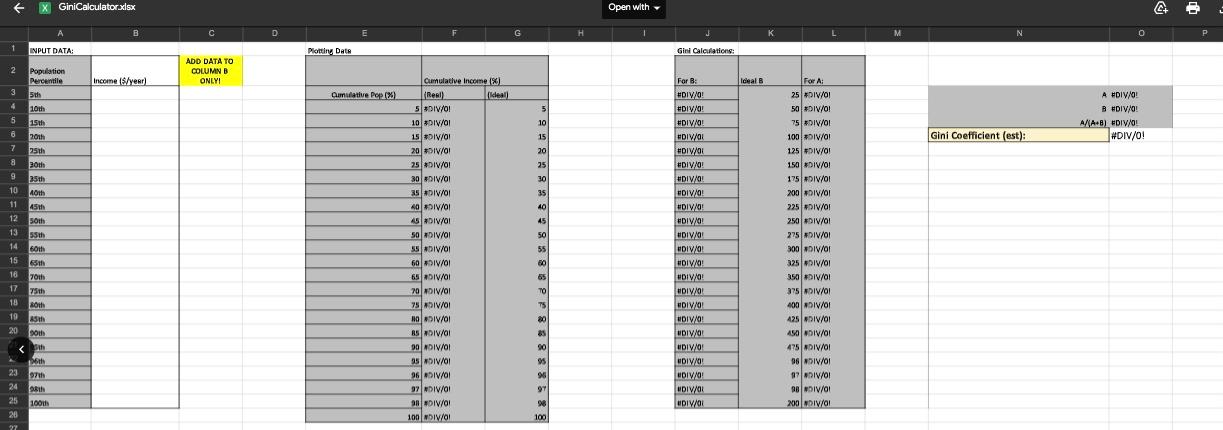
Ginicalculator.xlsx provided below:

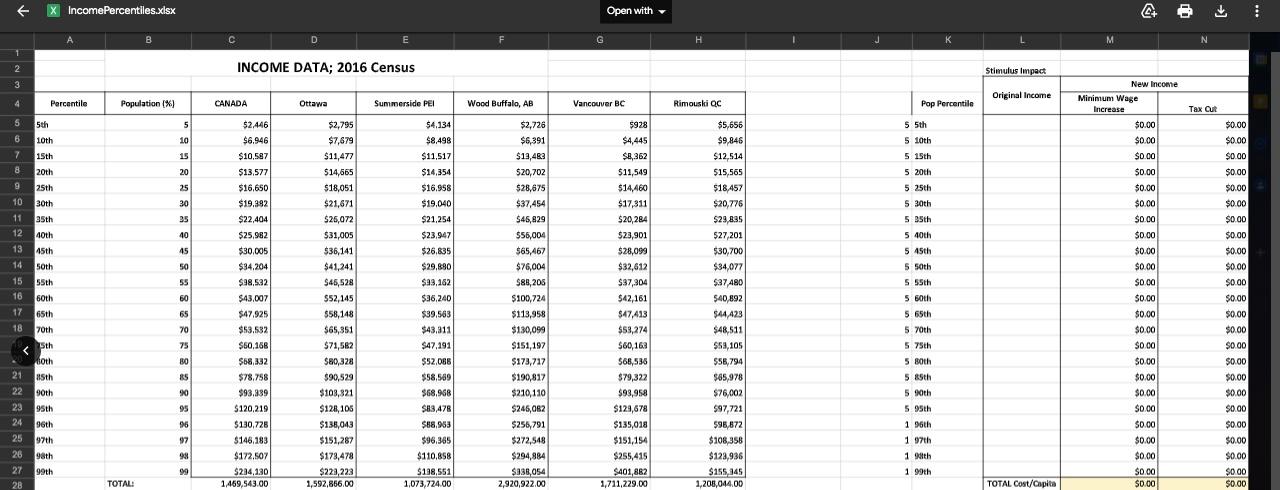
Income percentiles.xlsx provided below:

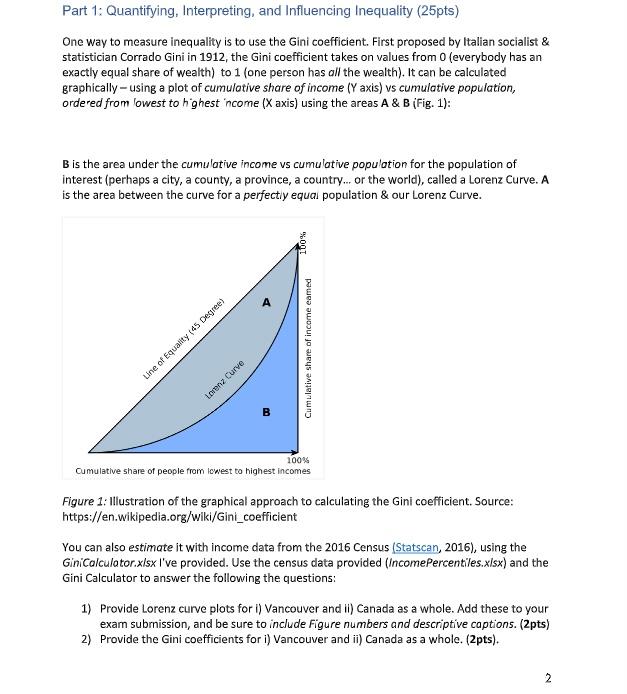
Part 1: Quantifying, Interpreting, and Influencing Inequality (25pts) One way to measure inequality is to use the Gini coefficient. First proposed by Italian socialist & statistician Corrado Gini in 1912, the Gini coefficient takes on values from 0 (everybody has an exactly equal share of wealth) to 1 (one person has all the wealth). It can be calculated graphically-using a plot of cumulative share of income (Y axis) vs cumulative population, ordered from lowest to highest income (Xaxis) using the areas A & B (Fig. 1): B is the area under the cumulative income vs cumulative population for the population of interest (perhaps a city, a county, a province, a country... or the world), called a Lorenz Curve. A is the area between the curve for a perfectly equal population & our Lorenz Curve. 00T A Cumulative share of income eamed Line of Equality [45 Degree Lorenz Curve B 100% Cumulative share of people from lowest to highest incomes Figure 1: Illustration of the graphical approach to calculating the Gini coefficient. Source: https://en.wikipedia.org/wiki/Gini_coefficient You can also estimate it with income data from the 2016 Census (Statscan, 2016), using the GiniCalculator.xlsx l've provided. Use the census data provided (IncomePercentiles.xlsx) and the Gini Calculator to answer the following the questions: 1) Provide Lorenz curve plots for i) Vancouver and il) Canada as a whole. Add these to your exam subrnission, and be sure to include Figure numbers and descriptive captions. (2pts) 2) Provide the Gini coefficients for i) Vancouver and ii) Canada as a whole. (2pts). 2 X GiniCalculators Open with C B D J r K L . W N INPUT DATA Plottiny Date meg Gini Calculations: 2 Population Percentile ADD DATA TO COLUMN ONLYI Income (S/year) For B: Ideal B Cumulative pop (%) O/AIGH 3 4 4 5 5th 10th Cumulative Income %) Real) (ideal! 5 #DIV/0! 10 #DIV/0 For A 25 #DIV/01 50 #DIV/0! 75 #DIV/OI 10/# 10/ A #DIV/0! B #DIV/O: A/A+B) NDIV/0! #DIV/0! ! 5 10 15 20 15th 2011 0 7 10/A# ST 10/AIGA 10/AIC# COE Gini Coefficient (est): : 25th 10/AIC# DC 125 #DIV/01 150 #DIV/01 8 20th 25 6 20 / 25 #DIV/01 30 #DIV/0 35 #DIV/OI 40 / / 10/AIG# SET 25th IOA 30 10 AN SE 11 40 451 50th 10/AIG OY 10/AIGN SY #DIV/0! #DIVO DIV/ #DIV/OL #DIV/0! #DIV/ DIVO #DIV/0! #DIV/0! DIVO HIV/O HOIVO! DIVO! DIVO HDIVOI 200 DIV/01 225 #DIV/O! 250 DIV/01 12 45 13 th 50 14 60th 300DIV/OI 6th 50DIV/OI / 60 91V/01 65 ADIV/AI 20 DIV/OI 10/AIGN SLC / 10/AIDSCE 15 16 10/AIGNSS / 10 55 60 65 70th 17 25th 350 #DIV/OI 375 #DIV/01 400 NDIV/01 / 18 Hox 10/AIGNS SE / OVATOR 85 19 20 NODIV01 TO T5 5 20 85 90 95 20th 10/AION SY / 10/AIGH SCV 10/AICOSY /


