Answered step by step
Verified Expert Solution
Question
1 Approved Answer
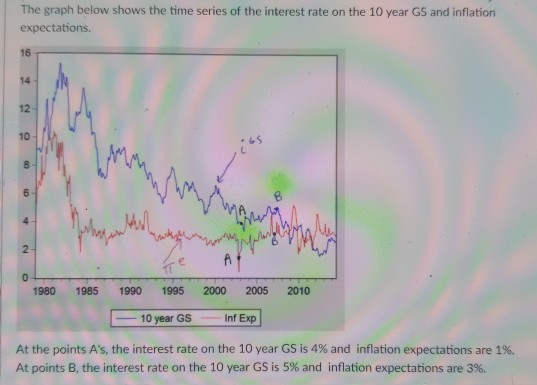
Will definitely give thumbs up for this. Please/Thanks! The graph below shows the time series of the interest rate on the 10 year GS and
Will definitely give thumbs up for this. Please/Thanks!


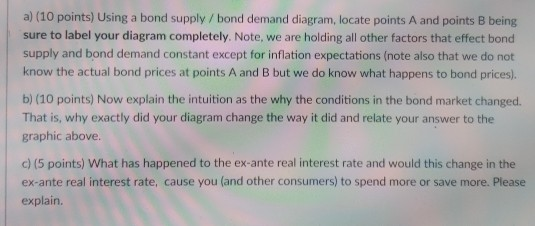
The graph below shows the time series of the interest rate on the 10 year GS and inflation expectations 16 14 12 10 65 8 4 2 1980 1985 1990 1995 2000 2005 2010 10 year GS Inf Exp At the points A's, the interest rate on the 10 year GS is 4% and inflation expectations are 1%. At points B, the interest rate on the 10 year GS is 5% and inflation expectations are 3%. a) (10 points) Using a bond supply /bond demand diagram, locate points A and points B being sure to label your diagram completely. Note, we are holding all other factors that effect bond supply and bond demand constant except for inflation expectations (note also that we do not know the actual bond prices at points A and B but we do know what happens to bond prices). b) (10 points) Now explain the intuition as the why the conditions in the bond market changed. That is, why exactly did your diagram change the way it did and relate your answer to the graphic above. c) (5 points) What has happened to the ex-ante real interest rate and would this change in the ex-ante real interest rate, cause you (and other consumers) to spend more or save more. Please explain
Step by Step Solution
There are 3 Steps involved in it
Step: 1

Get Instant Access to Expert-Tailored Solutions
See step-by-step solutions with expert insights and AI powered tools for academic success
Step: 2

Step: 3

Ace Your Homework with AI
Get the answers you need in no time with our AI-driven, step-by-step assistance
Get Started


