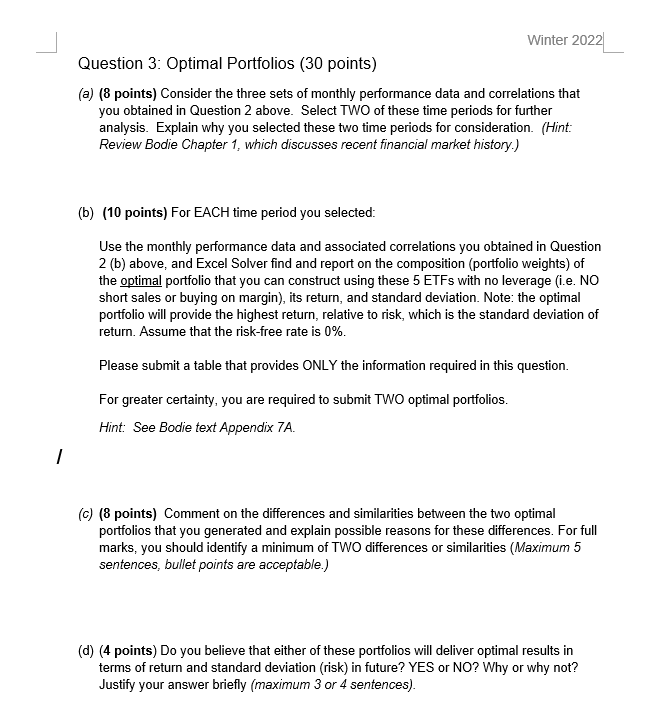
Winter 2022 Question 3: Optimal Portfolios (30 points) (a) (8 points) Consider the three sets of monthly performance data and correlations that you obtained in Question 2 above. Select TWO of these time periods for further analysis. Explain why you selected these two time periods for consideration. (Hint: Review Bodie Chapter 1, which discusses recent financial market history.) (b) (10 points) For EACH time period you selected: Use the monthly performance data and associated correlations you obtained in Question 2(b) above, and Excel Solver find and report on the composition (portfolio weights) of the optimal portfolio that you can construct using these 5 ETFs with no leverage (i.e. NO short sales or buying on margin), its return, and standard deviation. Note: the optimal portfolio will provide the highest return, relative to risk, which is the standard deviation of return. Assume that the risk-free rate is 0%. Please submit a table that provides ONLY the information required in this question. For greater certainty, you are required to submit TWO optimal portfolios. Hint: See Bodie text Appendix 7A. 1 (c) (8 points) Comment on the differences and similarities between the two optimal portfolios that you generated and explain possible reasons for these differences. For full marks, you should identify a minimum of TWO differences or similarities (Maximum 5 sentences, bullet points are acceptable.) (d) (4 points) Do you believe that either of these portfolios will deliver optimal results in terms of return and standard deviation (risk) in future? YES or NO? Why or why not? Justify your answer briefly (maximum 3 or 4 sentences). Winter 2022 Question 3: Optimal Portfolios (30 points) (a) (8 points) Consider the three sets of monthly performance data and correlations that you obtained in Question 2 above. Select TWO of these time periods for further analysis. Explain why you selected these two time periods for consideration. (Hint: Review Bodie Chapter 1, which discusses recent financial market history.) (b) (10 points) For EACH time period you selected: Use the monthly performance data and associated correlations you obtained in Question 2(b) above, and Excel Solver find and report on the composition (portfolio weights) of the optimal portfolio that you can construct using these 5 ETFs with no leverage (i.e. NO short sales or buying on margin), its return, and standard deviation. Note: the optimal portfolio will provide the highest return, relative to risk, which is the standard deviation of return. Assume that the risk-free rate is 0%. Please submit a table that provides ONLY the information required in this question. For greater certainty, you are required to submit TWO optimal portfolios. Hint: See Bodie text Appendix 7A. 1 (c) (8 points) Comment on the differences and similarities between the two optimal portfolios that you generated and explain possible reasons for these differences. For full marks, you should identify a minimum of TWO differences or similarities (Maximum 5 sentences, bullet points are acceptable.) (d) (4 points) Do you believe that either of these portfolios will deliver optimal results in terms of return and standard deviation (risk) in future? YES or NO? Why or why not? Justify your answer briefly (maximum 3 or 4 sentences)