Answered step by step
Verified Expert Solution
Question
1 Approved Answer
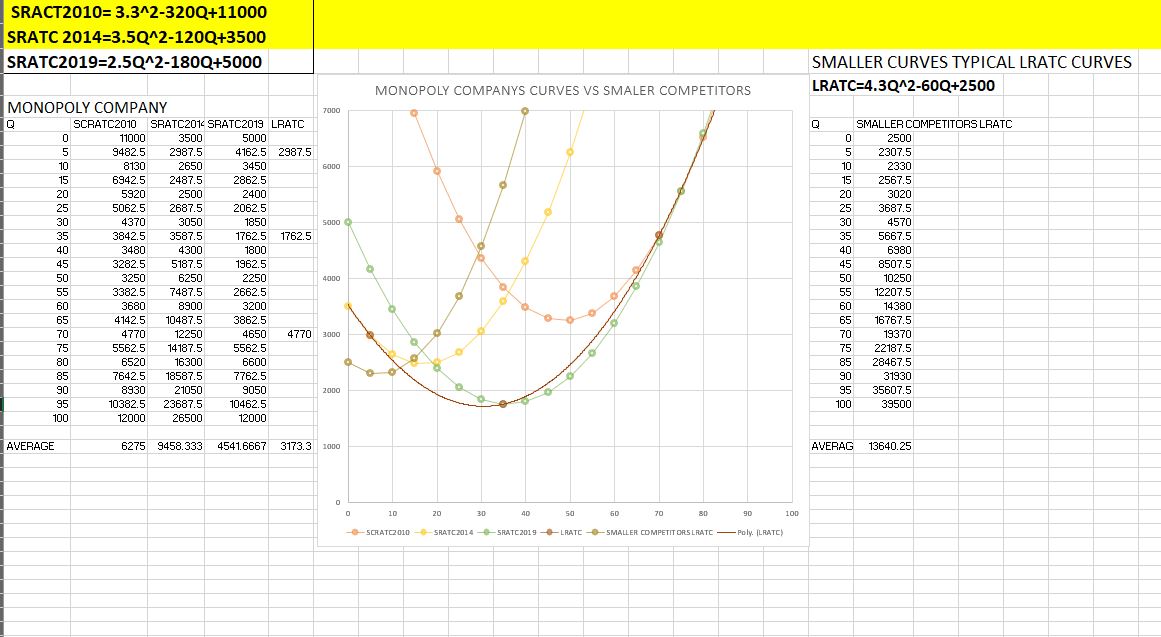
With all the information presented below compare the data and graph information that is given for the with the monopoly type behavior run company vs
With all the information presented below compare the data and graph information that is given for the with the monopoly "type" behavior run company vs the information on Long run production for a smaller competing firm.
In a more competitive industry with smaller firms, typical LRATC curves follow LRATC = 4.3Q2 - 60Q + 2,500. Present an argument that could be used to justify your company's size. Compare production costs, output, and scale the size of the monopoly company vs what curve is showing for the smaller competing firms.

Step by Step Solution
There are 3 Steps involved in it
Step: 1

Get Instant Access to Expert-Tailored Solutions
See step-by-step solutions with expert insights and AI powered tools for academic success
Step: 2

Step: 3

Ace Your Homework with AI
Get the answers you need in no time with our AI-driven, step-by-step assistance
Get Started


