

Question
Within the Excel spreadsheet, use the Excel tools/functions to calculate the correlation coefficient, test statistic, and the p-value. You will also use Excel to generate
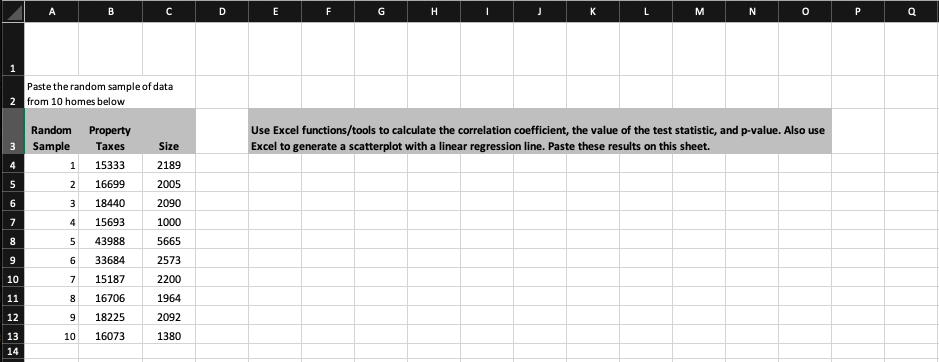
Within the Excel spreadsheet, use the Excel tools/functions to calculate the correlation coefficient, test statistic, and the p-value. You will also use Excel to generate a scatterplot of your sample data with a linear regression (line of best fit) model. All of these results should be shown on the Excel spreadsheet.
As your boss is not interested in sorting through data on a spreadsheet, you will then write up a professional report summarizing your findings. This report should include your scatterplot graph and any necessary tables. Within your report, in addition to any appropriate introductions, conclusions, citations, etc. also discussion the following:
? Interpret the correlation coefficient.
? Discuss the hypothesis in order to determine whether the population correlation between the two variables differs from zero.
? What are the results of the hypothesis test in the context of this task (at the 5% significance level)?
? What is the sample regression equation that could enable your to predict property taxes on the basis of the size of a home?
? Using this, predict the property taxes for a home that is 1,500 square ft.
This should be written as if you were writing a professional report to your employer.
Step by Step Solution
There are 3 Steps involved in it
Step: 1

Get Instant Access to Expert-Tailored Solutions
See step-by-step solutions with expert insights and AI powered tools for academic success
Step: 2

Step: 3
Ace Your Homework with AI
Get the answers you need in no time with our AI-driven, step-by-step assistance
Get Started
Finite Math And Applied Calculus
Authors: Stefan Waner, Steven Costenoble
6th Edition
1285415132, 9781285415130