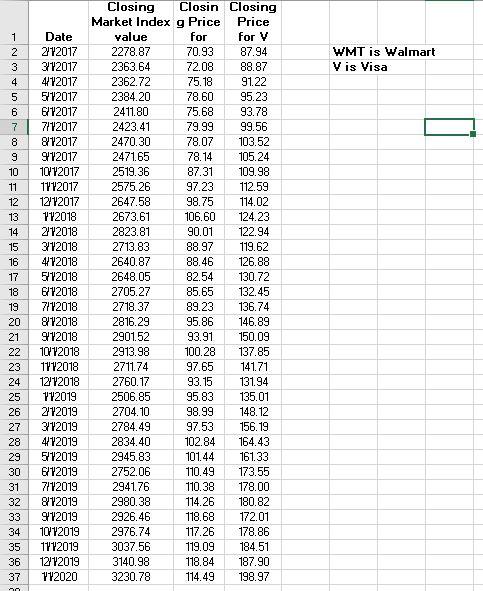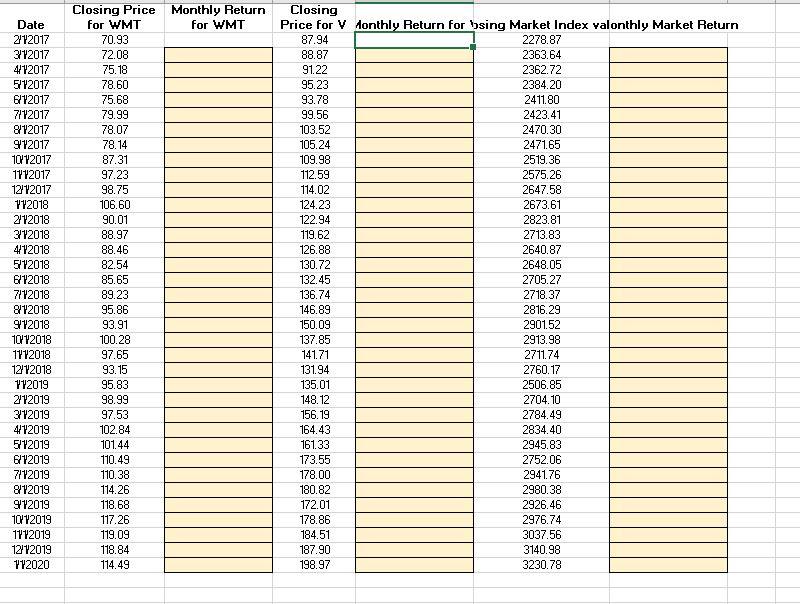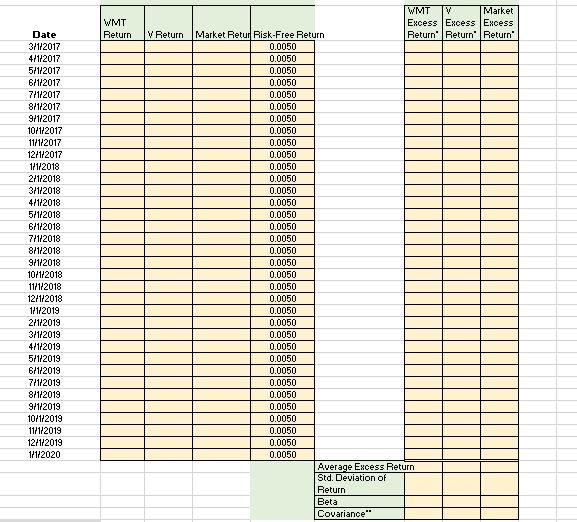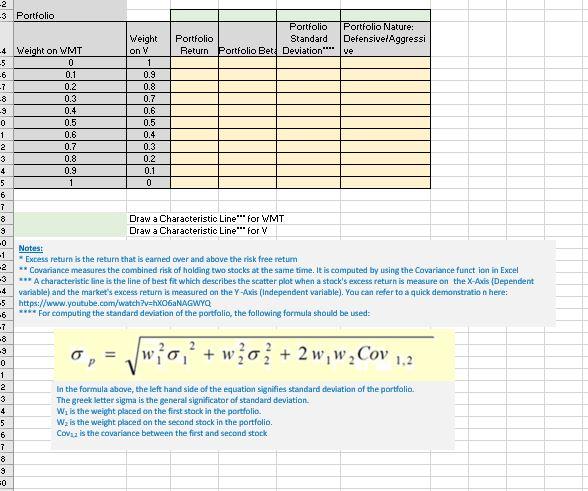


WMT is Walmart Vis Visa 18 98 889 88NOMNONNSoos No V AWN- Date 2112017 3112017 4/12017 5112017 6/12017 7112017 812017 9112017 10/12017 1112017 12112017 112018 2112018 3172018 412018 5112018 6/12018 7/12018 812018 9112018 10/12018 1172018 12/12018 172019 272019 312019 4/72019 5112019 6112019 7112019 812019 9112019 10/72019 1112019 12/12019 142020 Closing Closin Closing Market Index g Price Price value for for V 2278.87 70.93 87.94 2363.64 72.08 88.87 2362.72 75.18 91.22 2384.20 78.60 95.23 2411.80 75.68 93.78 2423.41 79.99 99.56 2470.30 78.07 103.52 2471.65 78.14 105.24 2519.36 87.31 109.98 2575.26 97.23 112.59 2647.58 98.75 114.02 2673.61 106.60 124.23 2823.81 90.01 122.94 2713.83 88.97 119.62 2640.87 88.46 126.88 2648.05 82.54 130.72 2705.27 85.65 132.45 2718.37 89.23 136.74 2816.29 95.86 146.89 2901.52 93.91 150.09 2913.98 100.28 137.85 2711.74 97.65 141.71 2760.17 93.15 131.94 2506.85 95.83 135.01 2704.10 98.99 148.12 2784.49 97.53 156.19 2834.40 102.84 164.43 2945.83 101.44 161.33 2752.06 110.49 173.55 2941.76 110.38 178.00 2980.38 114.26 180.82 2926.46 118.68 172.01 2976.74 117.26 178.86 3037.56 119.09 184.51 3140.98 118.84 187.90 3230.78 114.49 198.97 20 21 22 23 24 25 26 27 28 29 30 32 33 34 35 Monthly Return for WMT Date 212017 3112017 4/12017 5112017 6112017 7112017 812017 912017 10/72017 1112017 12112017 172018 2112018 3142018 4/12018 512018 6/12018 7112018 812018 912018 10/12018 1712018 12/12018 172019 272019 3112019 4/12019 5112019 6172019 7112019 812019 9112019 10/12019 1712019 12/12019 112020 Closing Price for WMT 70.93 72.08 75.18 78.60 75.68 79.99 78.07 78.14 87.31 97.23 98.75 106.60 90.01 88.97 88.46 82.54 85.65 89.23 95.86 93.91 100.28 97.65 93.15 95.83 98.99 97.53 102.84 101.44 110.49 110.38 114.26 118.68 117.26 119.09 118.84 114.49 Closing Price for V Monthly Return for "sing Market Index Yalonthly Market Return 87.94 2278.87 88.87 2363.64 91.22 2362.72 95.23 2384.20 93.78 2411.80 99.56 2423.41 103.52 2470.30 105.24 2471.65 109.98 2519.36 112.59 2575.26 114.02 2647.58 124.23 2673.61 122.94 2823.81 119.62 2713.83 126.88 2640.87 130.72 2648.05 132.45 2705.27 136.74 2718.37 146.89 2816.29 150.09 2901.52 137.85 2913.98 141.71 2711.74 131.94 2760.17 135.01 2506.85 148.12 2704.10 156.19 2784.49 164.43 2834.40 161.33 2945.83 173.55 2752.06 178.00 2941.76 180.82 2980.38 172.01 2926.46 178.86 2976.74 184.51 3037.56 187.90 3140.98 198.97 3230.78 WMT Return V Return Date 3/1/2017 4/1/2017 5/1/2017 6/1/2017 7/1/2017 8/1/2017 9/1/2017 10/1/2017 11/1/2017 12/1/2017 1/1/2018 2/1/2018 3/1/2018 4/1/2018 5/1/2018 6/1/2018 7/1/2018 8/1/2018 9/1/2018 10/1/2018 11/1/2018 12/1/2018 1/1/2019 2/1/2019 3/1/2019 4/1/2019 5/1/2019 6/1/2019 7/1/2019 8/1/2019 9/1/2019 10/1/2019 11/1/2019 12/1/2019 1/1/2020 WMT Y Market Excess Excess Excess Market Retur Risk-Free Return Return Return Return 0.0050 0.0050 0.0050 0.0050 0.0050 0.0050 0.0050 0.0050 0.0050 0.0050 0.0050 0.0050 0.0050 0.0050 0.0050 0.0050 0.0050 0.0050 0.0050 0.0050 0.0050 0.0050 0.0050 0.0050 0.0050 0.0050 0.0050 0.0050 0.0050 0.0050 0.0050 0.0050 0.0050 0.0050 0.0050 Average Excess Return Std. Deviation of Return Beta Covariance" 2 -3 Portfolio Portfolio Portfolio Nature: Weight Portfolio Standard DefensivelAggressi -4 Weight on WMT on V Return Portfolio Bet Deviation"" ve -5 0 1 -6 0.1 0.9 -7 0.2 0.8 -8 0.3 0.7 -9 0.4 0.6 0 0.5 0.5 1 0.6 0.4 2 0.7 0.3 3 0.8 0.2 4 0.9 0.1 5 1 0 6 7 8 Draw a Characteristic Line" for WMT 9 Draw a Characteristic Line" for V -0 Notest -1 Excess return is the return that is earned over and above the risk free retum -2 ** Covariance measures the combined risk of holding two stocks at the same time. It is computed by using the Covariance function in Excel -3 *** A characteristic line is the line of best fit which describes the scatter plot when a stock's excess return is measure on the X-Acis Dependent 4 variable) and the market's excess return is measured on the Y-Axis (Independent variable). You can refer to a quick demonstration here: -5 https://www.youtube.com/watch?v=hxO6aNAGWYQ -6 ****For computing the standard deviation of the portfolio, the following formula should be used: -7 -8 -9 0 1 2 in the formula above, the left hand side of the equation signifies standard deviation of the portfolio 3 The greek letter sigma is the general significator of standard deviation 4 W is the weight placed on the first stock in the portfolio 5 Wz is the weight placed on the second stock in the portfolio 6 Covuz is the covariance between the first and second stock 7 8 9 0 w upo,+ wo + 2 w, w,Cov 1.2 WMT is Walmart Vis Visa 18 98 889 88NOMNONNSoos No V AWN- Date 2112017 3112017 4/12017 5112017 6/12017 7112017 812017 9112017 10/12017 1112017 12112017 112018 2112018 3172018 412018 5112018 6/12018 7/12018 812018 9112018 10/12018 1172018 12/12018 172019 272019 312019 4/72019 5112019 6112019 7112019 812019 9112019 10/72019 1112019 12/12019 142020 Closing Closin Closing Market Index g Price Price value for for V 2278.87 70.93 87.94 2363.64 72.08 88.87 2362.72 75.18 91.22 2384.20 78.60 95.23 2411.80 75.68 93.78 2423.41 79.99 99.56 2470.30 78.07 103.52 2471.65 78.14 105.24 2519.36 87.31 109.98 2575.26 97.23 112.59 2647.58 98.75 114.02 2673.61 106.60 124.23 2823.81 90.01 122.94 2713.83 88.97 119.62 2640.87 88.46 126.88 2648.05 82.54 130.72 2705.27 85.65 132.45 2718.37 89.23 136.74 2816.29 95.86 146.89 2901.52 93.91 150.09 2913.98 100.28 137.85 2711.74 97.65 141.71 2760.17 93.15 131.94 2506.85 95.83 135.01 2704.10 98.99 148.12 2784.49 97.53 156.19 2834.40 102.84 164.43 2945.83 101.44 161.33 2752.06 110.49 173.55 2941.76 110.38 178.00 2980.38 114.26 180.82 2926.46 118.68 172.01 2976.74 117.26 178.86 3037.56 119.09 184.51 3140.98 118.84 187.90 3230.78 114.49 198.97 20 21 22 23 24 25 26 27 28 29 30 32 33 34 35 Monthly Return for WMT Date 212017 3112017 4/12017 5112017 6112017 7112017 812017 912017 10/72017 1112017 12112017 172018 2112018 3142018 4/12018 512018 6/12018 7112018 812018 912018 10/12018 1712018 12/12018 172019 272019 3112019 4/12019 5112019 6172019 7112019 812019 9112019 10/12019 1712019 12/12019 112020 Closing Price for WMT 70.93 72.08 75.18 78.60 75.68 79.99 78.07 78.14 87.31 97.23 98.75 106.60 90.01 88.97 88.46 82.54 85.65 89.23 95.86 93.91 100.28 97.65 93.15 95.83 98.99 97.53 102.84 101.44 110.49 110.38 114.26 118.68 117.26 119.09 118.84 114.49 Closing Price for V Monthly Return for "sing Market Index Yalonthly Market Return 87.94 2278.87 88.87 2363.64 91.22 2362.72 95.23 2384.20 93.78 2411.80 99.56 2423.41 103.52 2470.30 105.24 2471.65 109.98 2519.36 112.59 2575.26 114.02 2647.58 124.23 2673.61 122.94 2823.81 119.62 2713.83 126.88 2640.87 130.72 2648.05 132.45 2705.27 136.74 2718.37 146.89 2816.29 150.09 2901.52 137.85 2913.98 141.71 2711.74 131.94 2760.17 135.01 2506.85 148.12 2704.10 156.19 2784.49 164.43 2834.40 161.33 2945.83 173.55 2752.06 178.00 2941.76 180.82 2980.38 172.01 2926.46 178.86 2976.74 184.51 3037.56 187.90 3140.98 198.97 3230.78 WMT Return V Return Date 3/1/2017 4/1/2017 5/1/2017 6/1/2017 7/1/2017 8/1/2017 9/1/2017 10/1/2017 11/1/2017 12/1/2017 1/1/2018 2/1/2018 3/1/2018 4/1/2018 5/1/2018 6/1/2018 7/1/2018 8/1/2018 9/1/2018 10/1/2018 11/1/2018 12/1/2018 1/1/2019 2/1/2019 3/1/2019 4/1/2019 5/1/2019 6/1/2019 7/1/2019 8/1/2019 9/1/2019 10/1/2019 11/1/2019 12/1/2019 1/1/2020 WMT Y Market Excess Excess Excess Market Retur Risk-Free Return Return Return Return 0.0050 0.0050 0.0050 0.0050 0.0050 0.0050 0.0050 0.0050 0.0050 0.0050 0.0050 0.0050 0.0050 0.0050 0.0050 0.0050 0.0050 0.0050 0.0050 0.0050 0.0050 0.0050 0.0050 0.0050 0.0050 0.0050 0.0050 0.0050 0.0050 0.0050 0.0050 0.0050 0.0050 0.0050 0.0050 Average Excess Return Std. Deviation of Return Beta Covariance" 2 -3 Portfolio Portfolio Portfolio Nature: Weight Portfolio Standard DefensivelAggressi -4 Weight on WMT on V Return Portfolio Bet Deviation"" ve -5 0 1 -6 0.1 0.9 -7 0.2 0.8 -8 0.3 0.7 -9 0.4 0.6 0 0.5 0.5 1 0.6 0.4 2 0.7 0.3 3 0.8 0.2 4 0.9 0.1 5 1 0 6 7 8 Draw a Characteristic Line" for WMT 9 Draw a Characteristic Line" for V -0 Notest -1 Excess return is the return that is earned over and above the risk free retum -2 ** Covariance measures the combined risk of holding two stocks at the same time. It is computed by using the Covariance function in Excel -3 *** A characteristic line is the line of best fit which describes the scatter plot when a stock's excess return is measure on the X-Acis Dependent 4 variable) and the market's excess return is measured on the Y-Axis (Independent variable). You can refer to a quick demonstration here: -5 https://www.youtube.com/watch?v=hxO6aNAGWYQ -6 ****For computing the standard deviation of the portfolio, the following formula should be used: -7 -8 -9 0 1 2 in the formula above, the left hand side of the equation signifies standard deviation of the portfolio 3 The greek letter sigma is the general significator of standard deviation 4 W is the weight placed on the first stock in the portfolio 5 Wz is the weight placed on the second stock in the portfolio 6 Covuz is the covariance between the first and second stock 7 8 9 0 w upo,+ wo + 2 w, w,Cov 1.2


