Answered step by step
Verified Expert Solution
Link Copied!

Question

1 Approved Answer

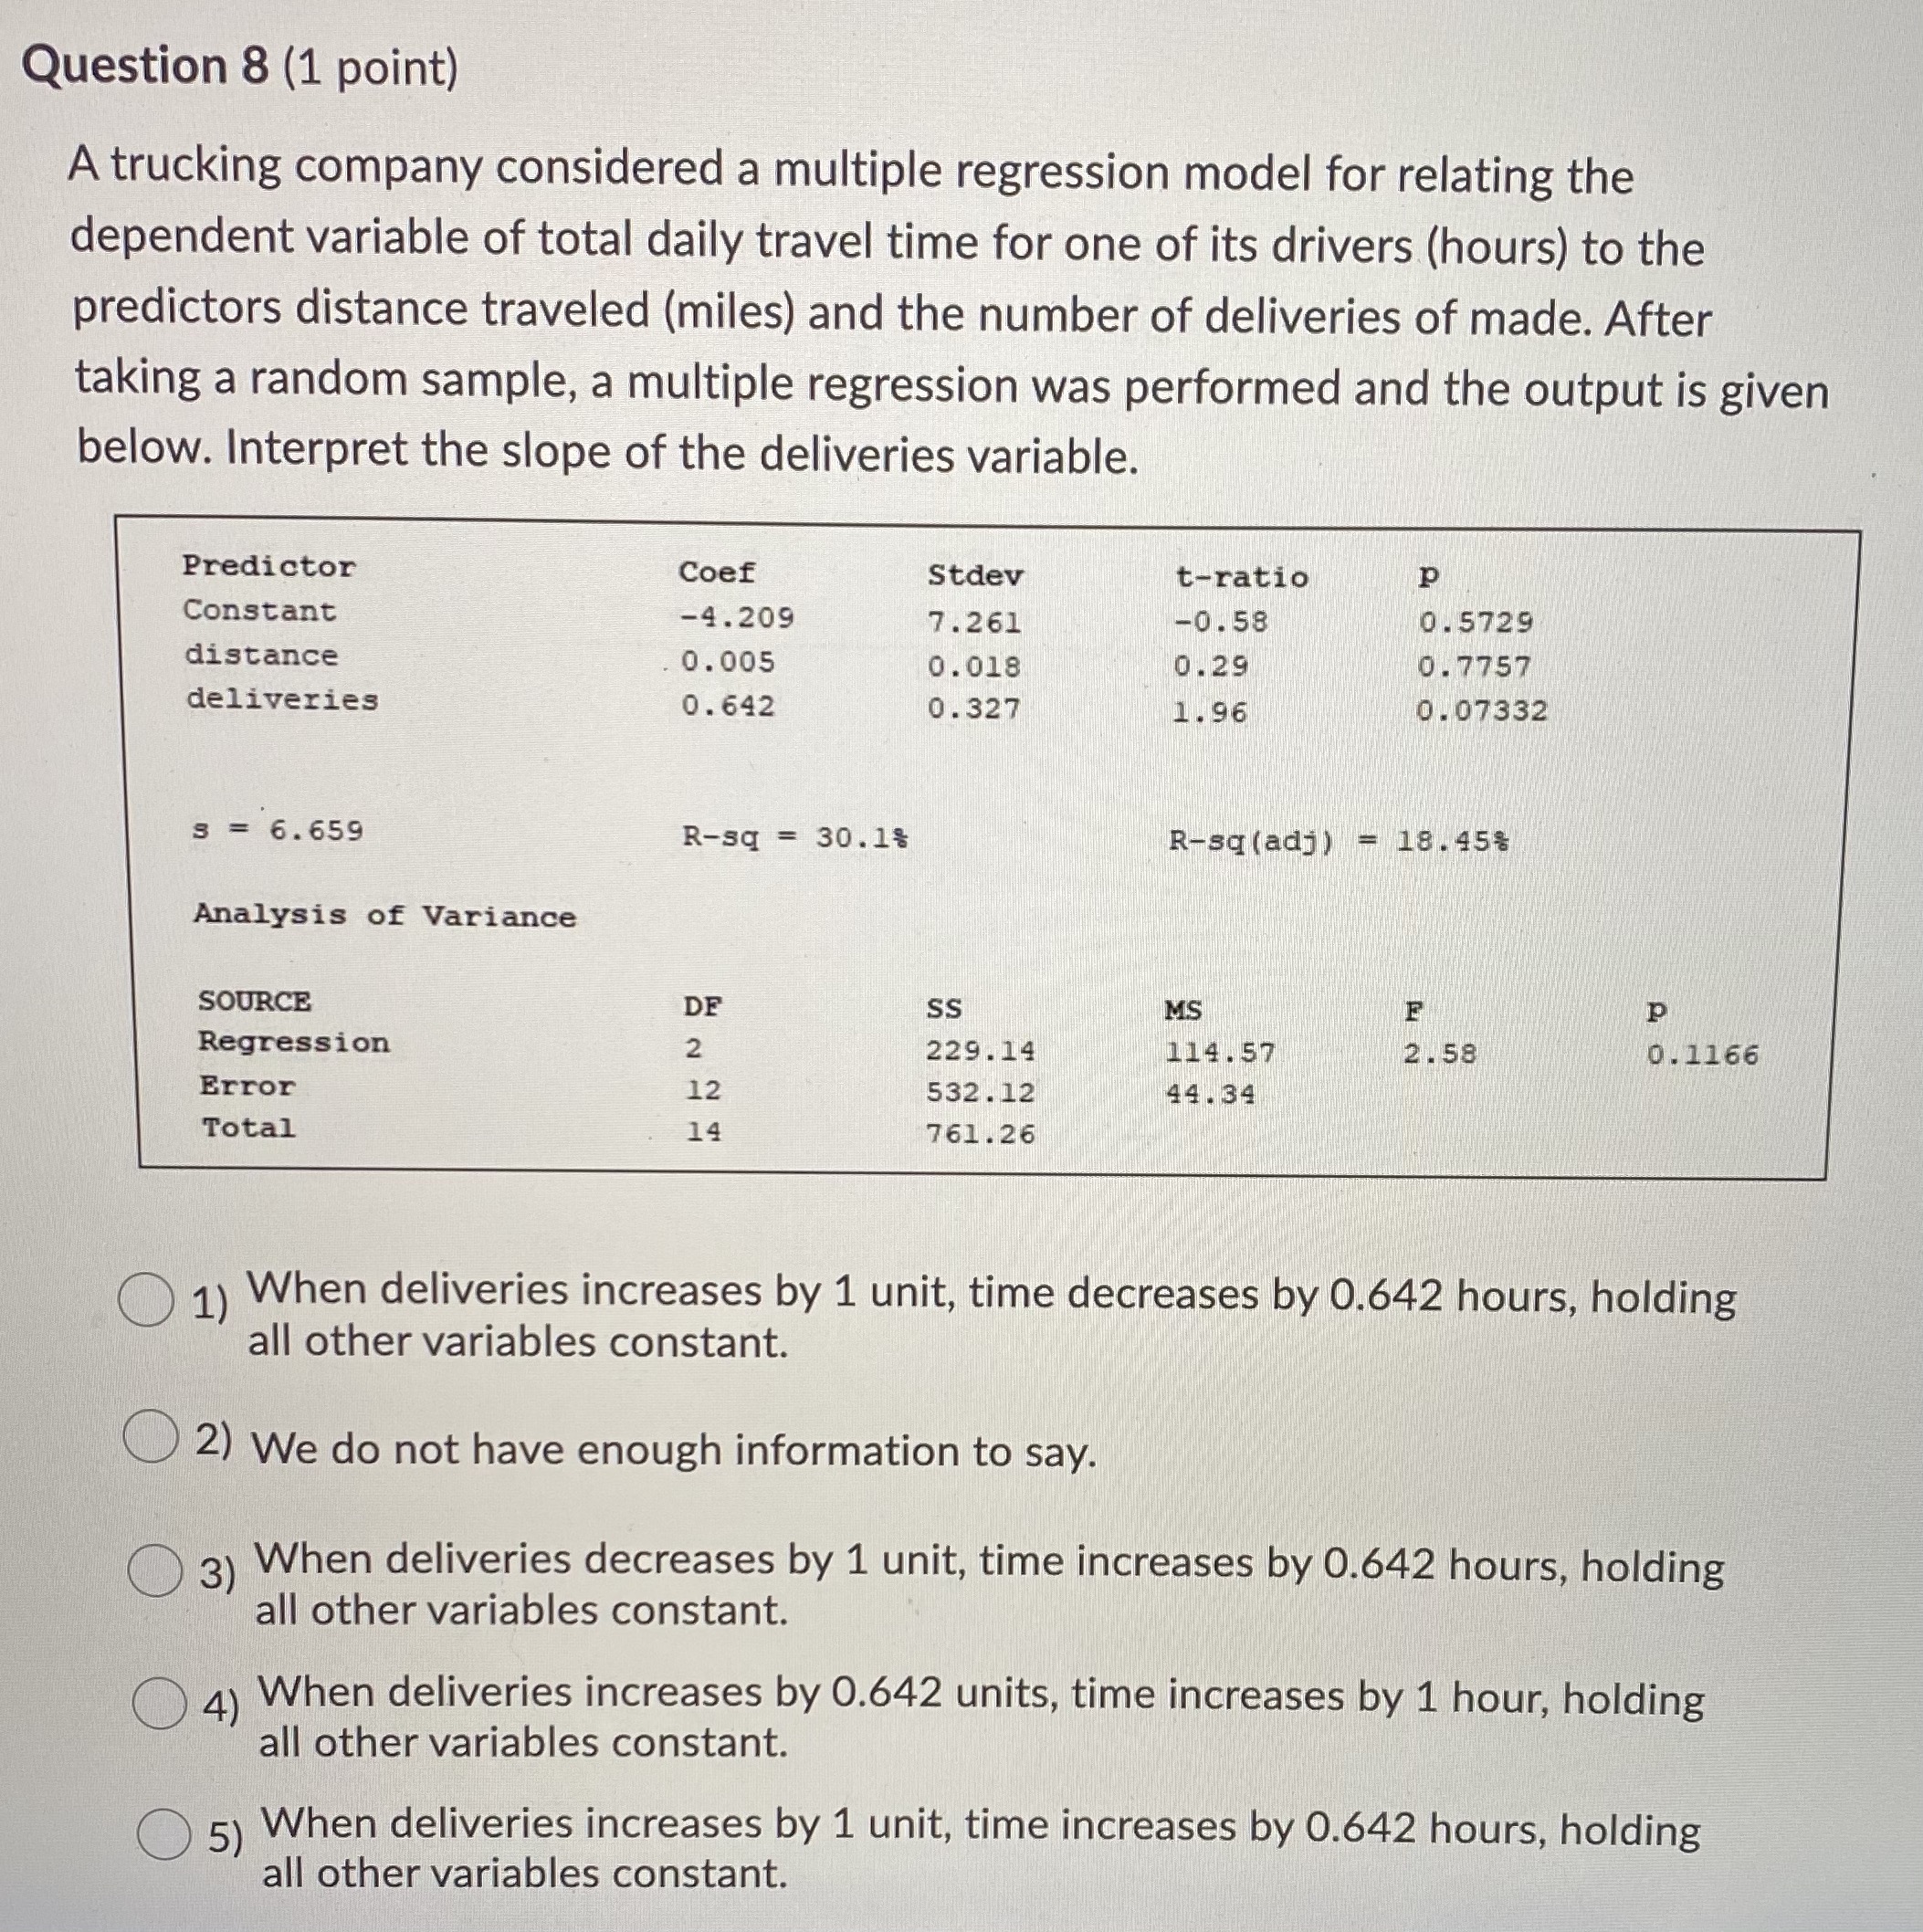
Work shown is not required, thank you. Question 8 (1 point) A trucking company considered a multiple regression model for relating the dependent variable of

Work shown is not required, thank you.

image text in transcribed
Question 8 (1 point) A trucking company considered a multiple regression model for relating the dependent variable of total daily travel time for one of its drivers (hours) to the predictors distance traveled (miles) and the number of deliveries of made. After taking a random sample, a multiple regression was performed and the output is given below. Interpret the slope of the deliveries variable. Predictor Coef Stdev t-ratio P Constant -4.209 7.261 -0. 58 0 .5729 distance 0 . 005 0. 018 0 . 29 0. 7757 deliveries 0 . 642 0. 327 1. 96 0 . 07332 3 = 6. 659 R-sq = 30.18 R-sq (adj ) - 18 . 45% Analysis of Variance SOURCE DF SS MS F P Regression 2 229 . 14 114 . 57 2 . 58 0. 1166 Error 12 532 . 12 44 . 34 Total 14 761. 26 1) When deliveries increases by 1 unit, time decreases by 0.642 hours, holding all other variables constant. 2) We do not have enough information to say. 3) When deliveries decreases by 1 unit, time increases by 0.642 hours, holding all other variables constant. 4) When deliveries increases by 0.642 units, time increases by 1 hour, holding all other variables constant. 5) When deliveries increases by 1 unit, time increases by 0.642 hours, holding all other variables constant

Step by Step Solution

There are 3 Steps involved in it

Step: 1

blur-text-image

Get Instant Access to Expert-Tailored Solutions

See step-by-step solutions with expert insights and AI powered tools for academic success

Step: 2

blur-text-image

Step: 3

blur-text-image

Ace Your Homework with AI

Get the answers you need in no time with our AI-driven, step-by-step assistance

Get Started

Recommended Textbook for

More Books

Students also viewed these Mathematics questions