

Answered step by step
Verified Expert Solution
Question
1 Approved Answer
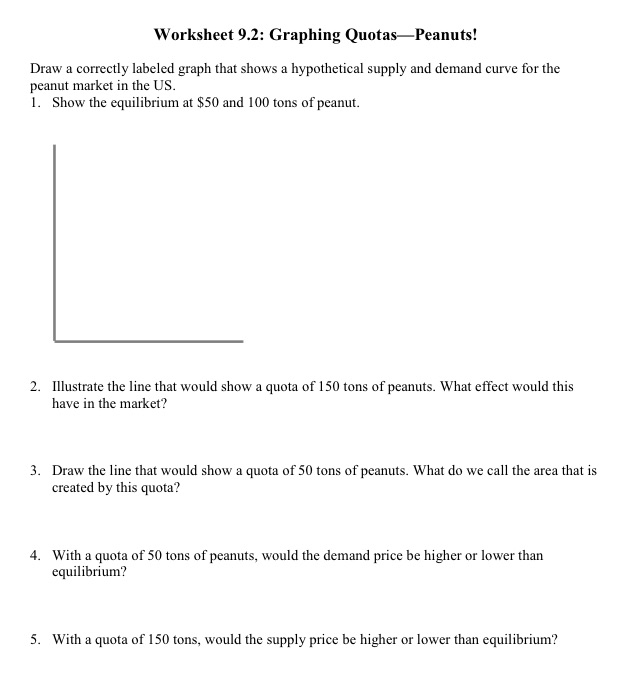
Worksheet 9.2: Graphing Quotas-Peanuts! Draw a correctly labeled graph that shows a hypothetical supply and demand curve for the peanut market in the US. 1.
Step by Step Solution
There are 3 Steps involved in it
Step: 1

Get Instant Access to Expert-Tailored Solutions
See step-by-step solutions with expert insights and AI powered tools for academic success
Step: 2

Step: 3
Ace Your Homework with AI
Get the answers you need in no time with our AI-driven, step-by-step assistance
Get Started
The Routledge To Global Political Economy Conversations And Inquiries
Authors: Ernesto Vivares
1st Edition
1351064525, 9781351064521