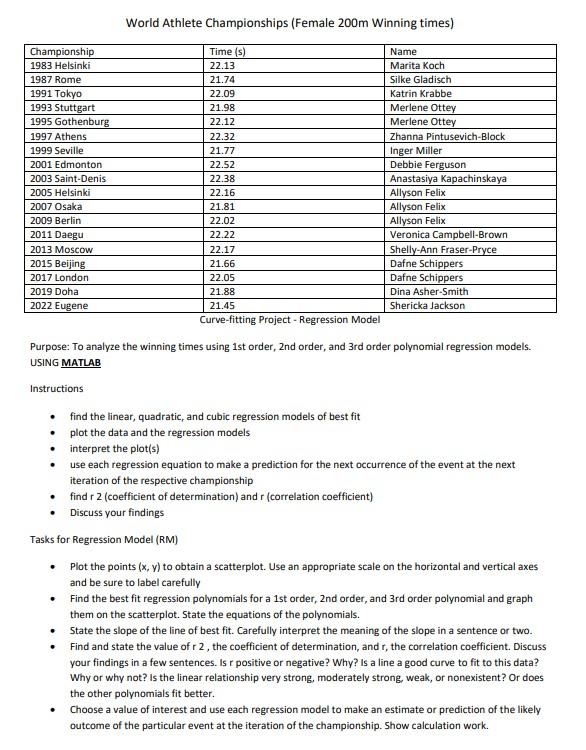
World Athlete Championships (Female 200m Winning times) Purpose: To analyze the winning times using 1st order, 2nd order, and 3rd order polynomial regression models. USING MATLAB Instructions - find the linear, quadratic, and cubic regression models of best fit - plot the data and the regression models - interpret the plot(s) - use each regression equation to make a prediction for the next occurrence of the event at the next iteration of the respective championship - find 2 (coefficient of determination) and r (correlation coefficient) - Discuss your findings Tasks for Regression Model (RM) - Plot the points (x,y) to obtain a scatterplot. Use an appropriate scale on the horizontal and vertical axes and be sure to label carefully - Find the best fit regression polynomials for a 1st order, 2nd order, and 3rd order polynomial and graph them on the scatterplot. State the equations of the polynomials. - State the slope of the line of best fit. Carefully interpret the meaning of the slope in a sentence or two. - Find and state the value of r2, the coefficient of determination, and r, the correlation coefficient. Discuss your findings in a few sentences. Is r positive or negative? Why? Is a line a good curve to fit to this data? Why or why not? Is the linear relationship very strong, moderately strong, weak, or nonexistent? Or does the other polynomials fit better. - Choose a value of interest and use each regression model to make an estimate or prediction of the likely outcome of the particular event at the iteration of the championship. Show calculation work. World Athlete Championships (Female 200m Winning times) Purpose: To analyze the winning times using 1st order, 2nd order, and 3rd order polynomial regression models. USING MATLAB Instructions - find the linear, quadratic, and cubic regression models of best fit - plot the data and the regression models - interpret the plot(s) - use each regression equation to make a prediction for the next occurrence of the event at the next iteration of the respective championship - find 2 (coefficient of determination) and r (correlation coefficient) - Discuss your findings Tasks for Regression Model (RM) - Plot the points (x,y) to obtain a scatterplot. Use an appropriate scale on the horizontal and vertical axes and be sure to label carefully - Find the best fit regression polynomials for a 1st order, 2nd order, and 3rd order polynomial and graph them on the scatterplot. State the equations of the polynomials. - State the slope of the line of best fit. Carefully interpret the meaning of the slope in a sentence or two. - Find and state the value of r2, the coefficient of determination, and r, the correlation coefficient. Discuss your findings in a few sentences. Is r positive or negative? Why? Is a line a good curve to fit to this data? Why or why not? Is the linear relationship very strong, moderately strong, weak, or nonexistent? Or does the other polynomials fit better. - Choose a value of interest and use each regression model to make an estimate or prediction of the likely outcome of the particular event at the iteration of the championship. Show calculation work


