Would like a step by step solution pics to this excel problem
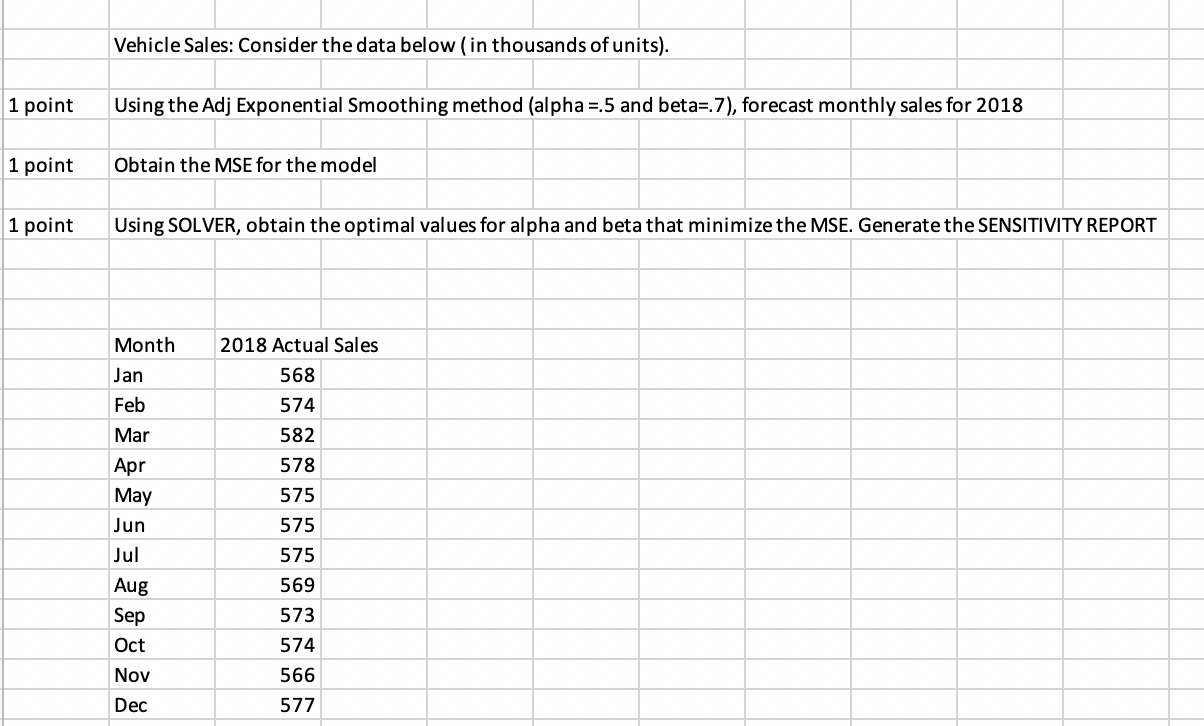
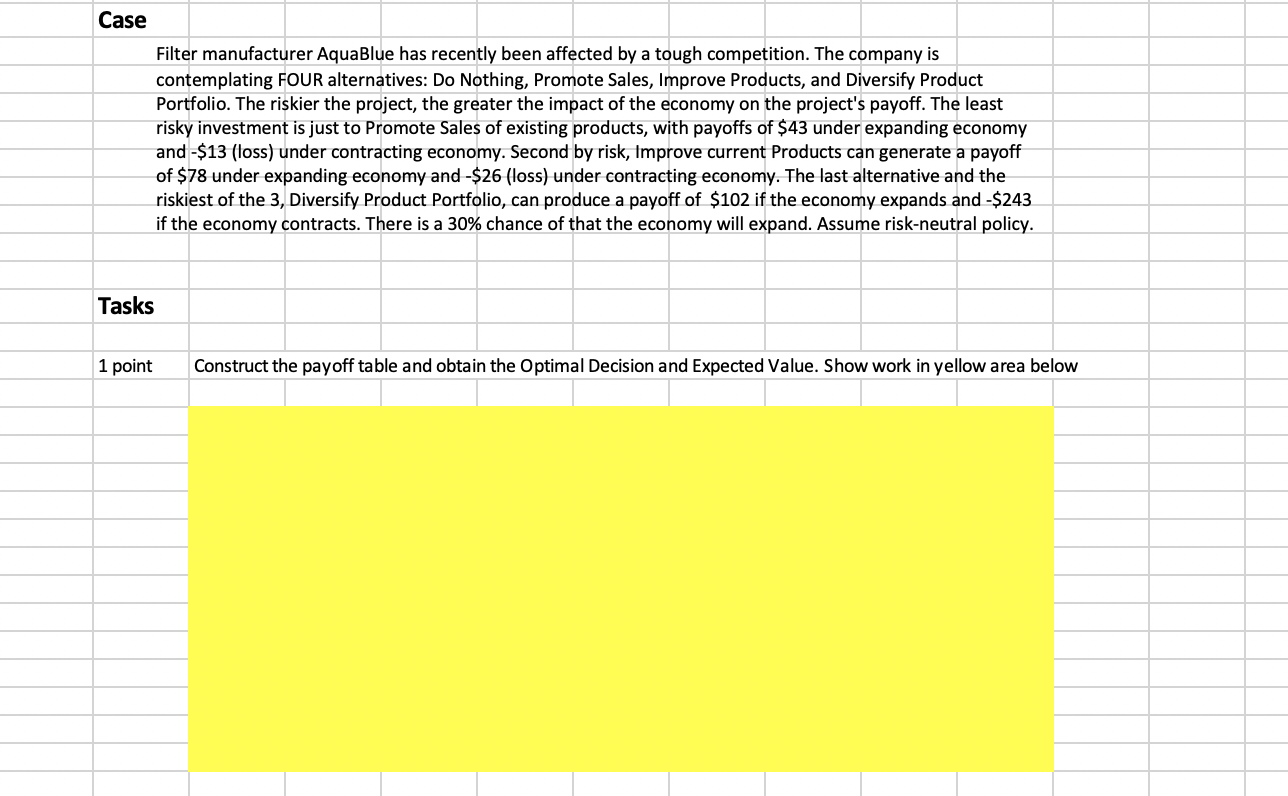
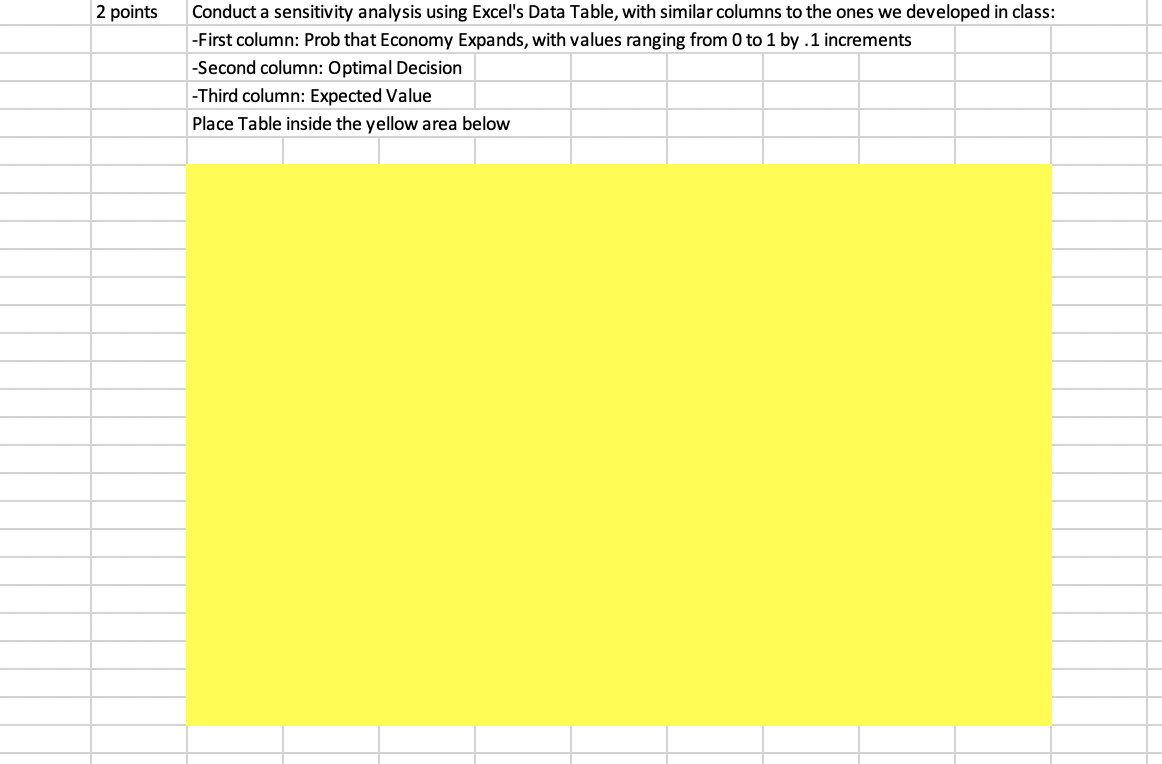
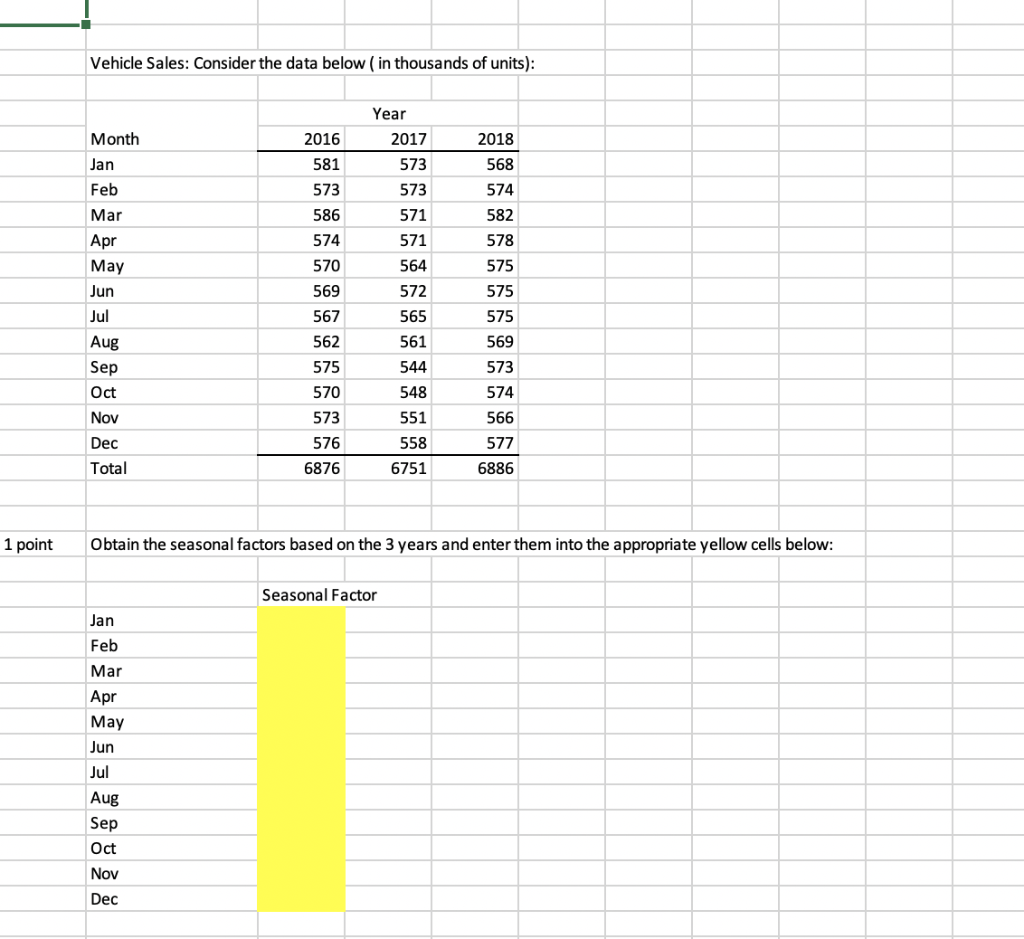
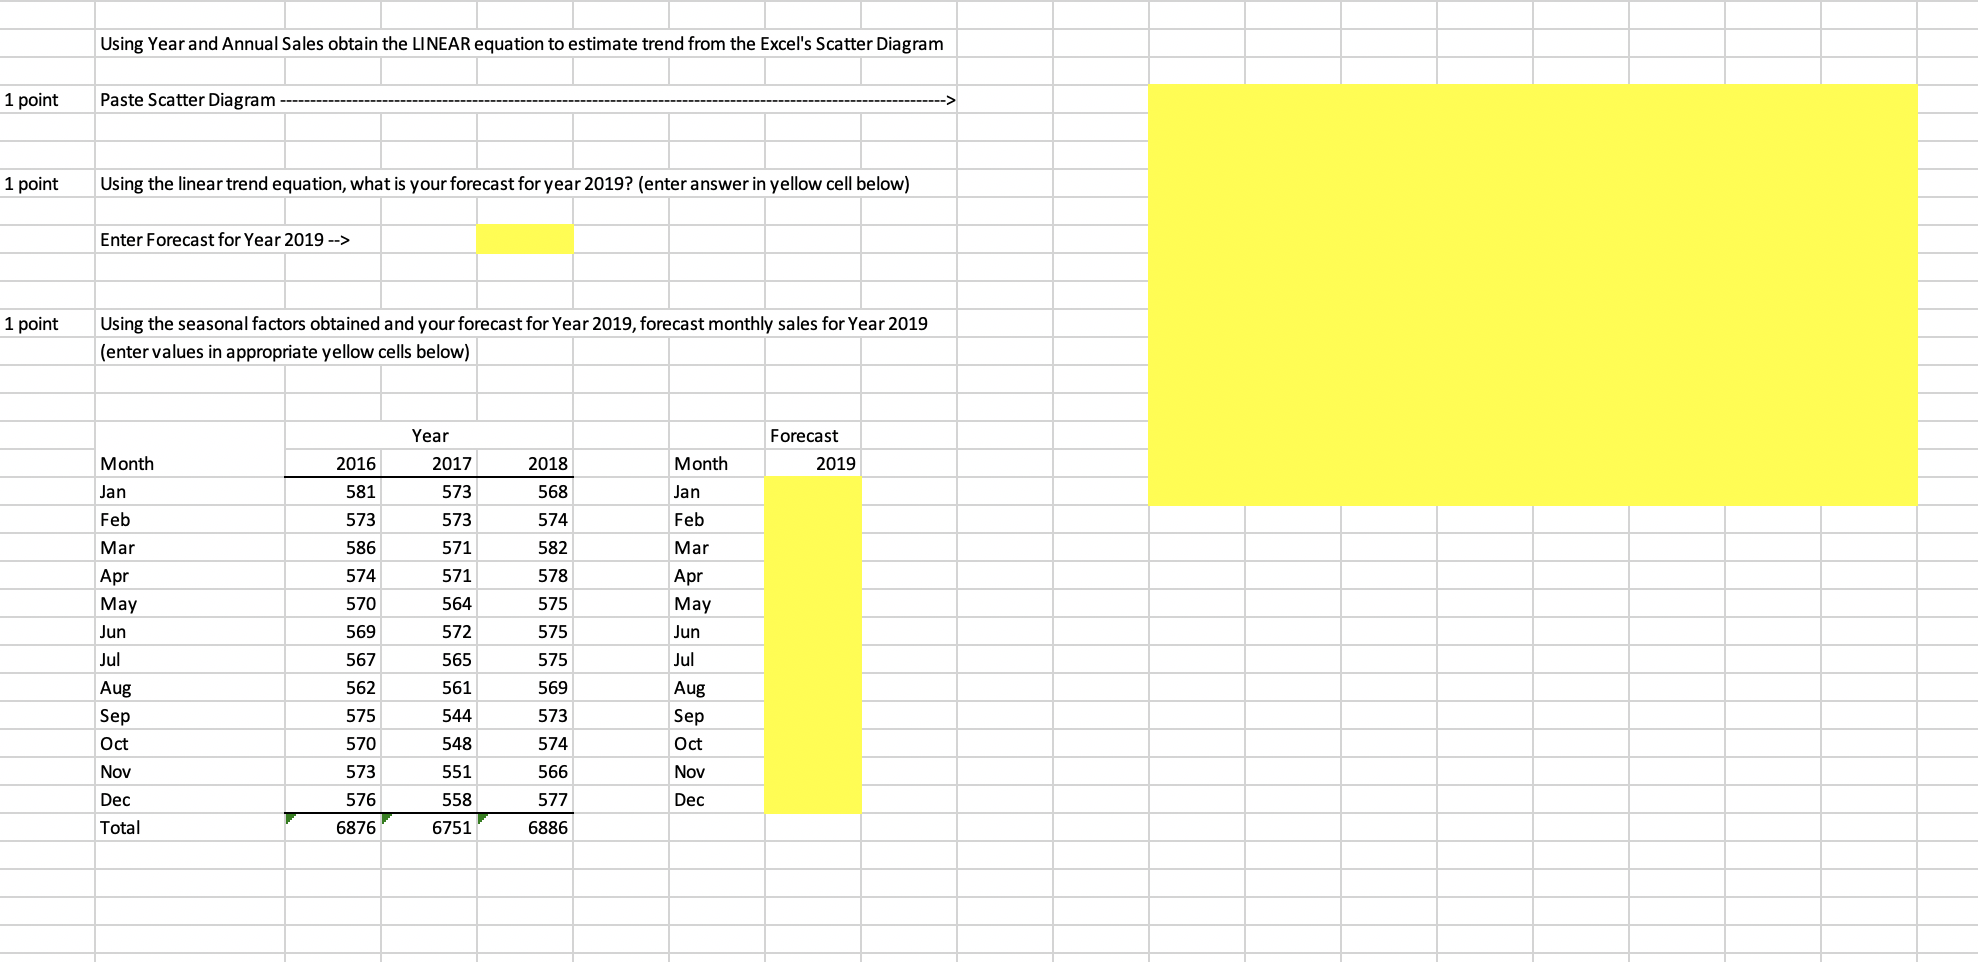
Vehicle Sales: Consider the data below (in thousands of units). 1 point Using the Adj Exponential Smoothing method (alpha=.5 and beta= 7), forecast monthly sales for 2018 1 point Obtain the MSE for the model 1 point Using SOLVER, obtain the optimal values for alpha and beta that minimize the MSE. Generate the SENSITIVITY REPORT Month Jan Feb Mar Apr May Jun Jul Aug 2018 Actual Sales 568 574 582 578 575 575 575 569 573 574 566 577 Sep Oct Nov Dec Case Filter manufacturer AquaBlue has recently been affected by a tough competition. The company is contemplating FOUR alternatives: Do Nothing, Promote Sales, Improve Products, and Diversify Product Portfolio. The riskier the project, the greater the impact of the economy on the project's payoff. The least risky investment is just to promote Sales of existing products, with payoffs of $43 under expanding economy and-$13 (loss) under contracting economy. Second by risk, improve current Products can generate a payoff of $78 under expanding economy and - $26 (loss) under contracting economy. The last alternative and the riskiest of the 3, Diversify Product Portfolio, can produce a payoff of $102 if the economy expands and $243 if the economy contracts. There is a 30% chance of that the economy will expand. Assume risk-neutral policy. Tasks 1 point Construct the payoff table and obtain the optimal Decision and Expected Value. Show work in yellow area below 2 points Conduct a sensitivity analysis using Excel's Data Table, with similar columns to the ones we developed in class: -First column: Prob that Economy Expands, with values ranging from 0 to 1 by .1 increments -Second column: Optimal Decision -Third column: Expected Value Place Table inside the yellow area below Vehicle Sales: Consider the data below ( in thousands of units): 2016 Month Jan 581 Feb 573 586 574 570 569 Year 2017 573 573 571 571 564 572 565 561 544 548 551 2018 568 574 582 578 575 575 575 Mar Apr May Jun Jul Aug Sep Oct Nov Dec Total 567 569 562 575 570 573 576 6876 573 574 566 577 6886 558 6751 1 point Obtain the seasonal factors based on the 3 years and enter them into the appropriate yellow cells below: Seasonal Factor Jan Feb Mar Apr May Jun Jul Aug Sep Oct Nov Dec Using Year and Annual Sales obtain the LINEAR equation to estimate trend from the Excel's Scatter Diagram 1 point Paste Scatter Diagram --------- -----------------------> 1 point Using the linear trend equation, what is your forecast for year 2019? (enter answer in yellow cell below) Enter Forecast for Year 2019 --> Using the seasonal factors obtained and your forecast for Year 2019, forecast monthly sales for Year 2019 (enter values in appropriate yellow cells below) Forecast 2019 Month Month Jan Jan Feb Mar 2016 581 573 586 574 570 569 Year 2017 573 573 571 571 564 572 565 561 544 548 551 558 6751 Feb Mar Apr May Jun 2018 568 574 582 578 575 575 575 569 573 574 566 577 6886 Apr May Jun Jul Aug Sep Oct Nov Dec Total 567 Jul 562 575 570 573 576 6876 Aug Sep Oct Nov Dec Vehicle Sales: Consider the data below (in thousands of units). 1 point Using the Adj Exponential Smoothing method (alpha=.5 and beta= 7), forecast monthly sales for 2018 1 point Obtain the MSE for the model 1 point Using SOLVER, obtain the optimal values for alpha and beta that minimize the MSE. Generate the SENSITIVITY REPORT Month Jan Feb Mar Apr May Jun Jul Aug 2018 Actual Sales 568 574 582 578 575 575 575 569 573 574 566 577 Sep Oct Nov Dec Case Filter manufacturer AquaBlue has recently been affected by a tough competition. The company is contemplating FOUR alternatives: Do Nothing, Promote Sales, Improve Products, and Diversify Product Portfolio. The riskier the project, the greater the impact of the economy on the project's payoff. The least risky investment is just to promote Sales of existing products, with payoffs of $43 under expanding economy and-$13 (loss) under contracting economy. Second by risk, improve current Products can generate a payoff of $78 under expanding economy and - $26 (loss) under contracting economy. The last alternative and the riskiest of the 3, Diversify Product Portfolio, can produce a payoff of $102 if the economy expands and $243 if the economy contracts. There is a 30% chance of that the economy will expand. Assume risk-neutral policy. Tasks 1 point Construct the payoff table and obtain the optimal Decision and Expected Value. Show work in yellow area below 2 points Conduct a sensitivity analysis using Excel's Data Table, with similar columns to the ones we developed in class: -First column: Prob that Economy Expands, with values ranging from 0 to 1 by .1 increments -Second column: Optimal Decision -Third column: Expected Value Place Table inside the yellow area below Vehicle Sales: Consider the data below ( in thousands of units): 2016 Month Jan 581 Feb 573 586 574 570 569 Year 2017 573 573 571 571 564 572 565 561 544 548 551 2018 568 574 582 578 575 575 575 Mar Apr May Jun Jul Aug Sep Oct Nov Dec Total 567 569 562 575 570 573 576 6876 573 574 566 577 6886 558 6751 1 point Obtain the seasonal factors based on the 3 years and enter them into the appropriate yellow cells below: Seasonal Factor Jan Feb Mar Apr May Jun Jul Aug Sep Oct Nov Dec Using Year and Annual Sales obtain the LINEAR equation to estimate trend from the Excel's Scatter Diagram 1 point Paste Scatter Diagram --------- -----------------------> 1 point Using the linear trend equation, what is your forecast for year 2019? (enter answer in yellow cell below) Enter Forecast for Year 2019 --> Using the seasonal factors obtained and your forecast for Year 2019, forecast monthly sales for Year 2019 (enter values in appropriate yellow cells below) Forecast 2019 Month Month Jan Jan Feb Mar 2016 581 573 586 574 570 569 Year 2017 573 573 571 571 564 572 565 561 544 548 551 558 6751 Feb Mar Apr May Jun 2018 568 574 582 578 575 575 575 569 573 574 566 577 6886 Apr May Jun Jul Aug Sep Oct Nov Dec Total 567 Jul 562 575 570 573 576 6876 Aug Sep Oct Nov Dec


