

Question
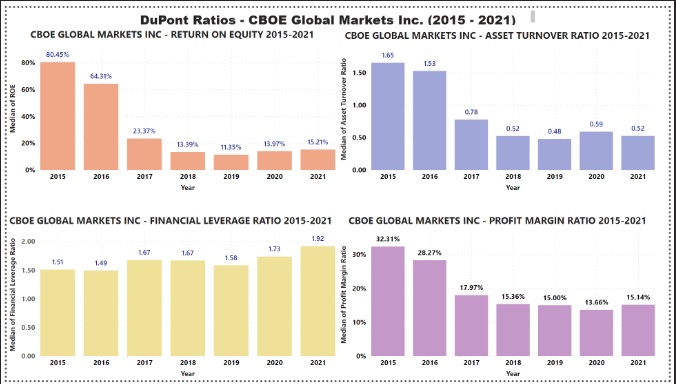
Would like to know if someone can provide me the exact steps I need to use in POWER BI to create the below stacked column
Would like to know if someone can provide me the exact steps I need to use in POWER BI to create the below stacked column chart as far as filters, visualizations and data check marks to create this chart? I have the excel data I need to uploaded to power BI I just need step by step instruction on creating this chart? Thanks.
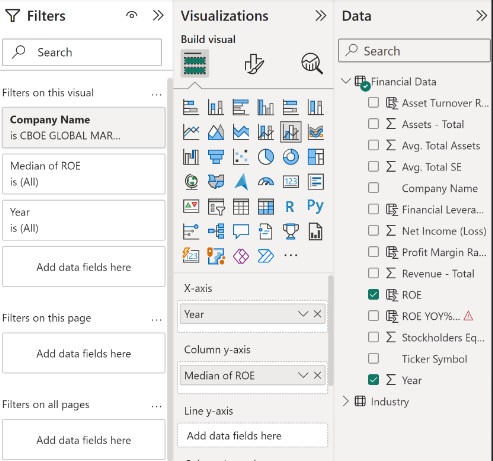 DuPont Ratios - CBOE Glohal Markets Inc. (2015 - 2021) search Financial Data Assets - Total Avg. Total Assets Avg. Total SE Company Name Financial Levera... Net Income (Loss) Profit Margin Ra... Revenue - Total E ROE [E. ROE YOY\%... Stockholders Eq... Ticker Symbol Year Industry DuPont Ratios - CBOE Glohal Markets Inc. (2015 - 2021) search Financial Data Assets - Total Avg. Total Assets Avg. Total SE Company Name Financial Levera... Net Income (Loss) Profit Margin Ra... Revenue - Total E ROE [E. ROE YOY\%... Stockholders Eq... Ticker Symbol Year Industry
 Step by Step Solution
There are 3 Steps involved in it
Step: 1

Get Instant Access to Expert-Tailored Solutions
See step-by-step solutions with expert insights and AI powered tools for academic success
Step: 2

Step: 3
Ace Your Homework with AI
Get the answers you need in no time with our AI-driven, step-by-step assistance
Get Started
Using Financial Accounting Information The Alternative to Debits and Credits
Authors: Gary A. Porter, Curtis L. Norton
7th Edition
978-0-538-4527, 0-538-45274-9, 978-1133161646