would you be able to help me with this part of my lab please? part b) 45 (adapt the table as needed based on the
would you be able to help me with this part of my lab please? part b)
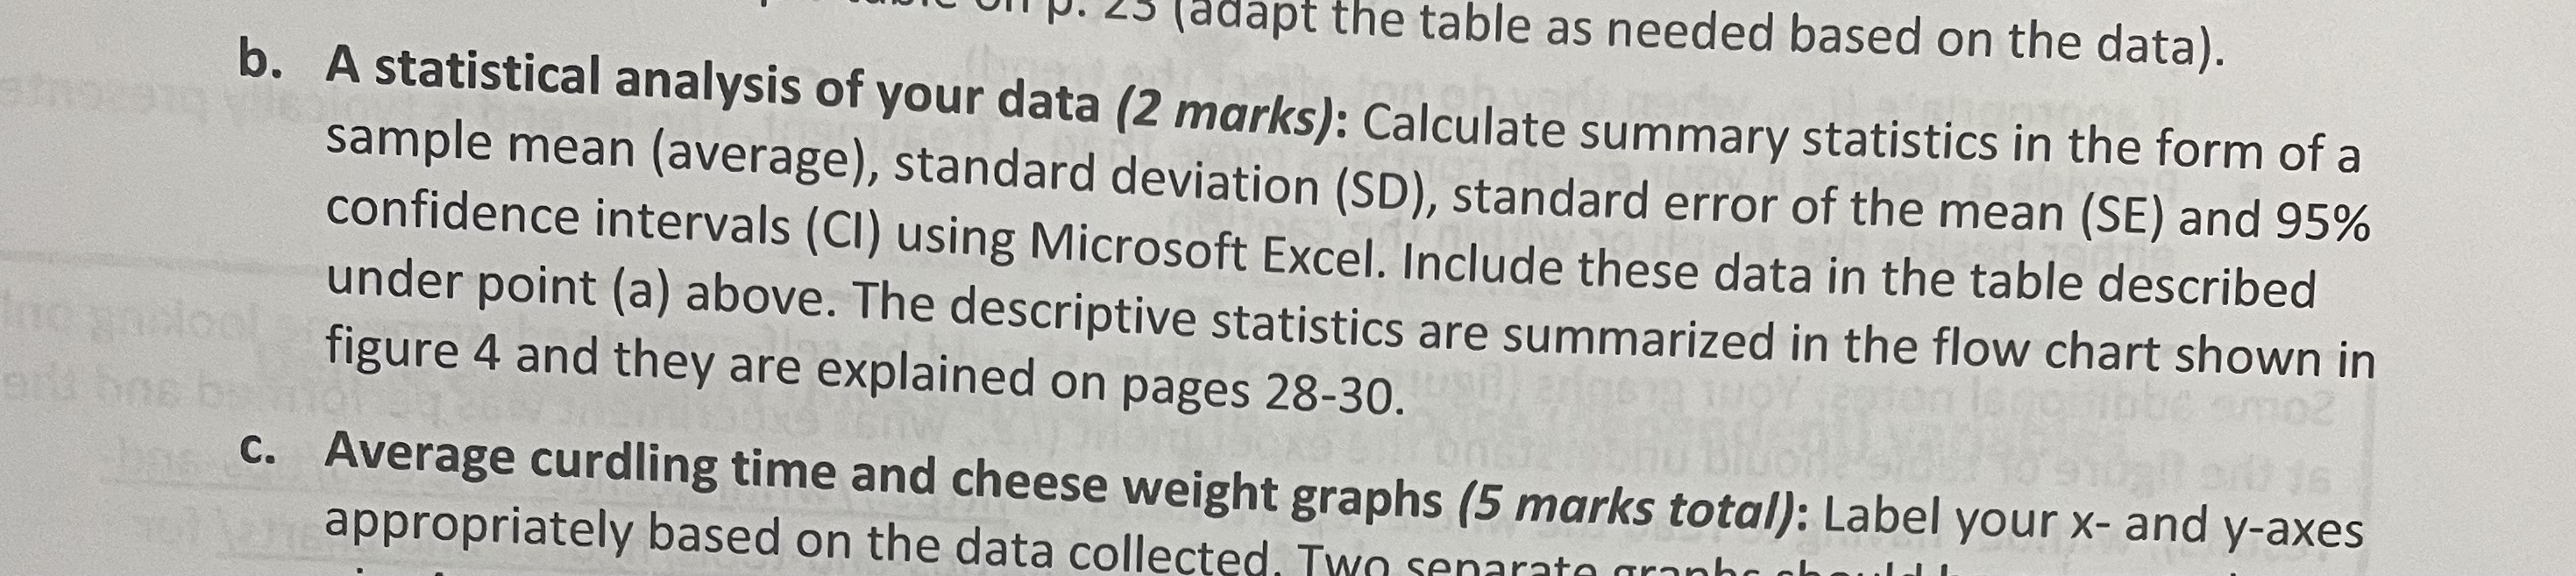
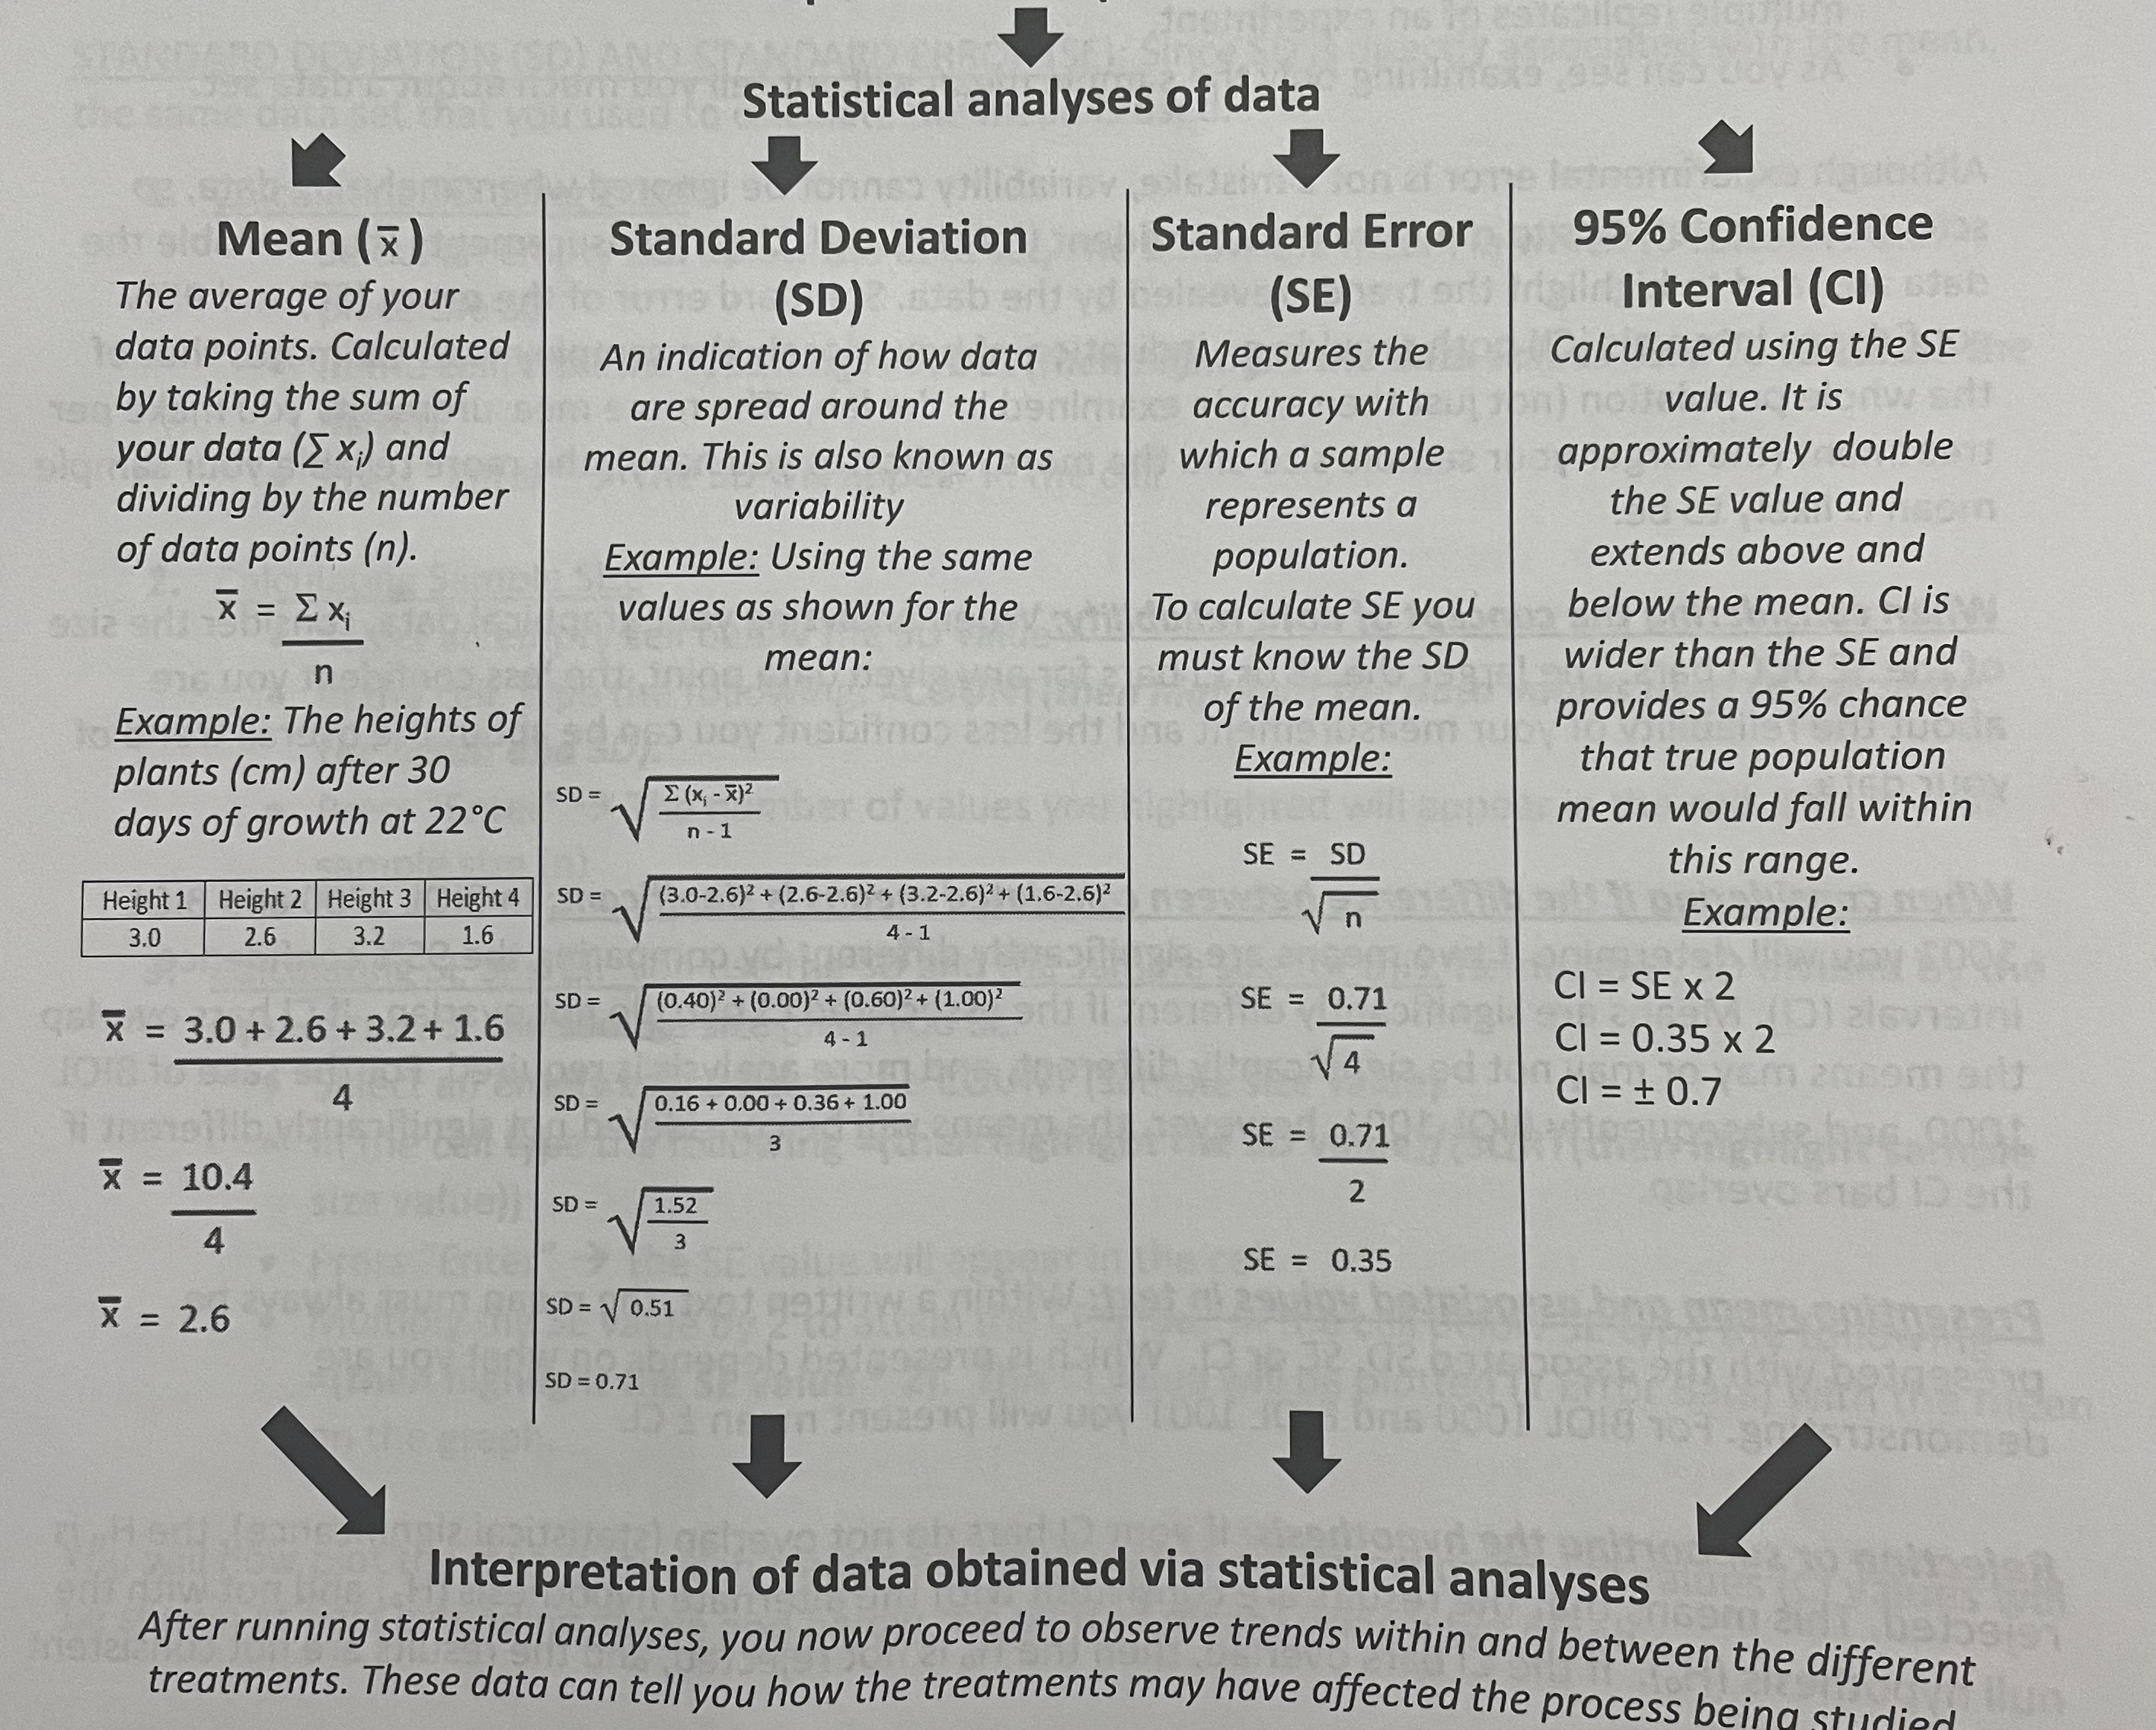
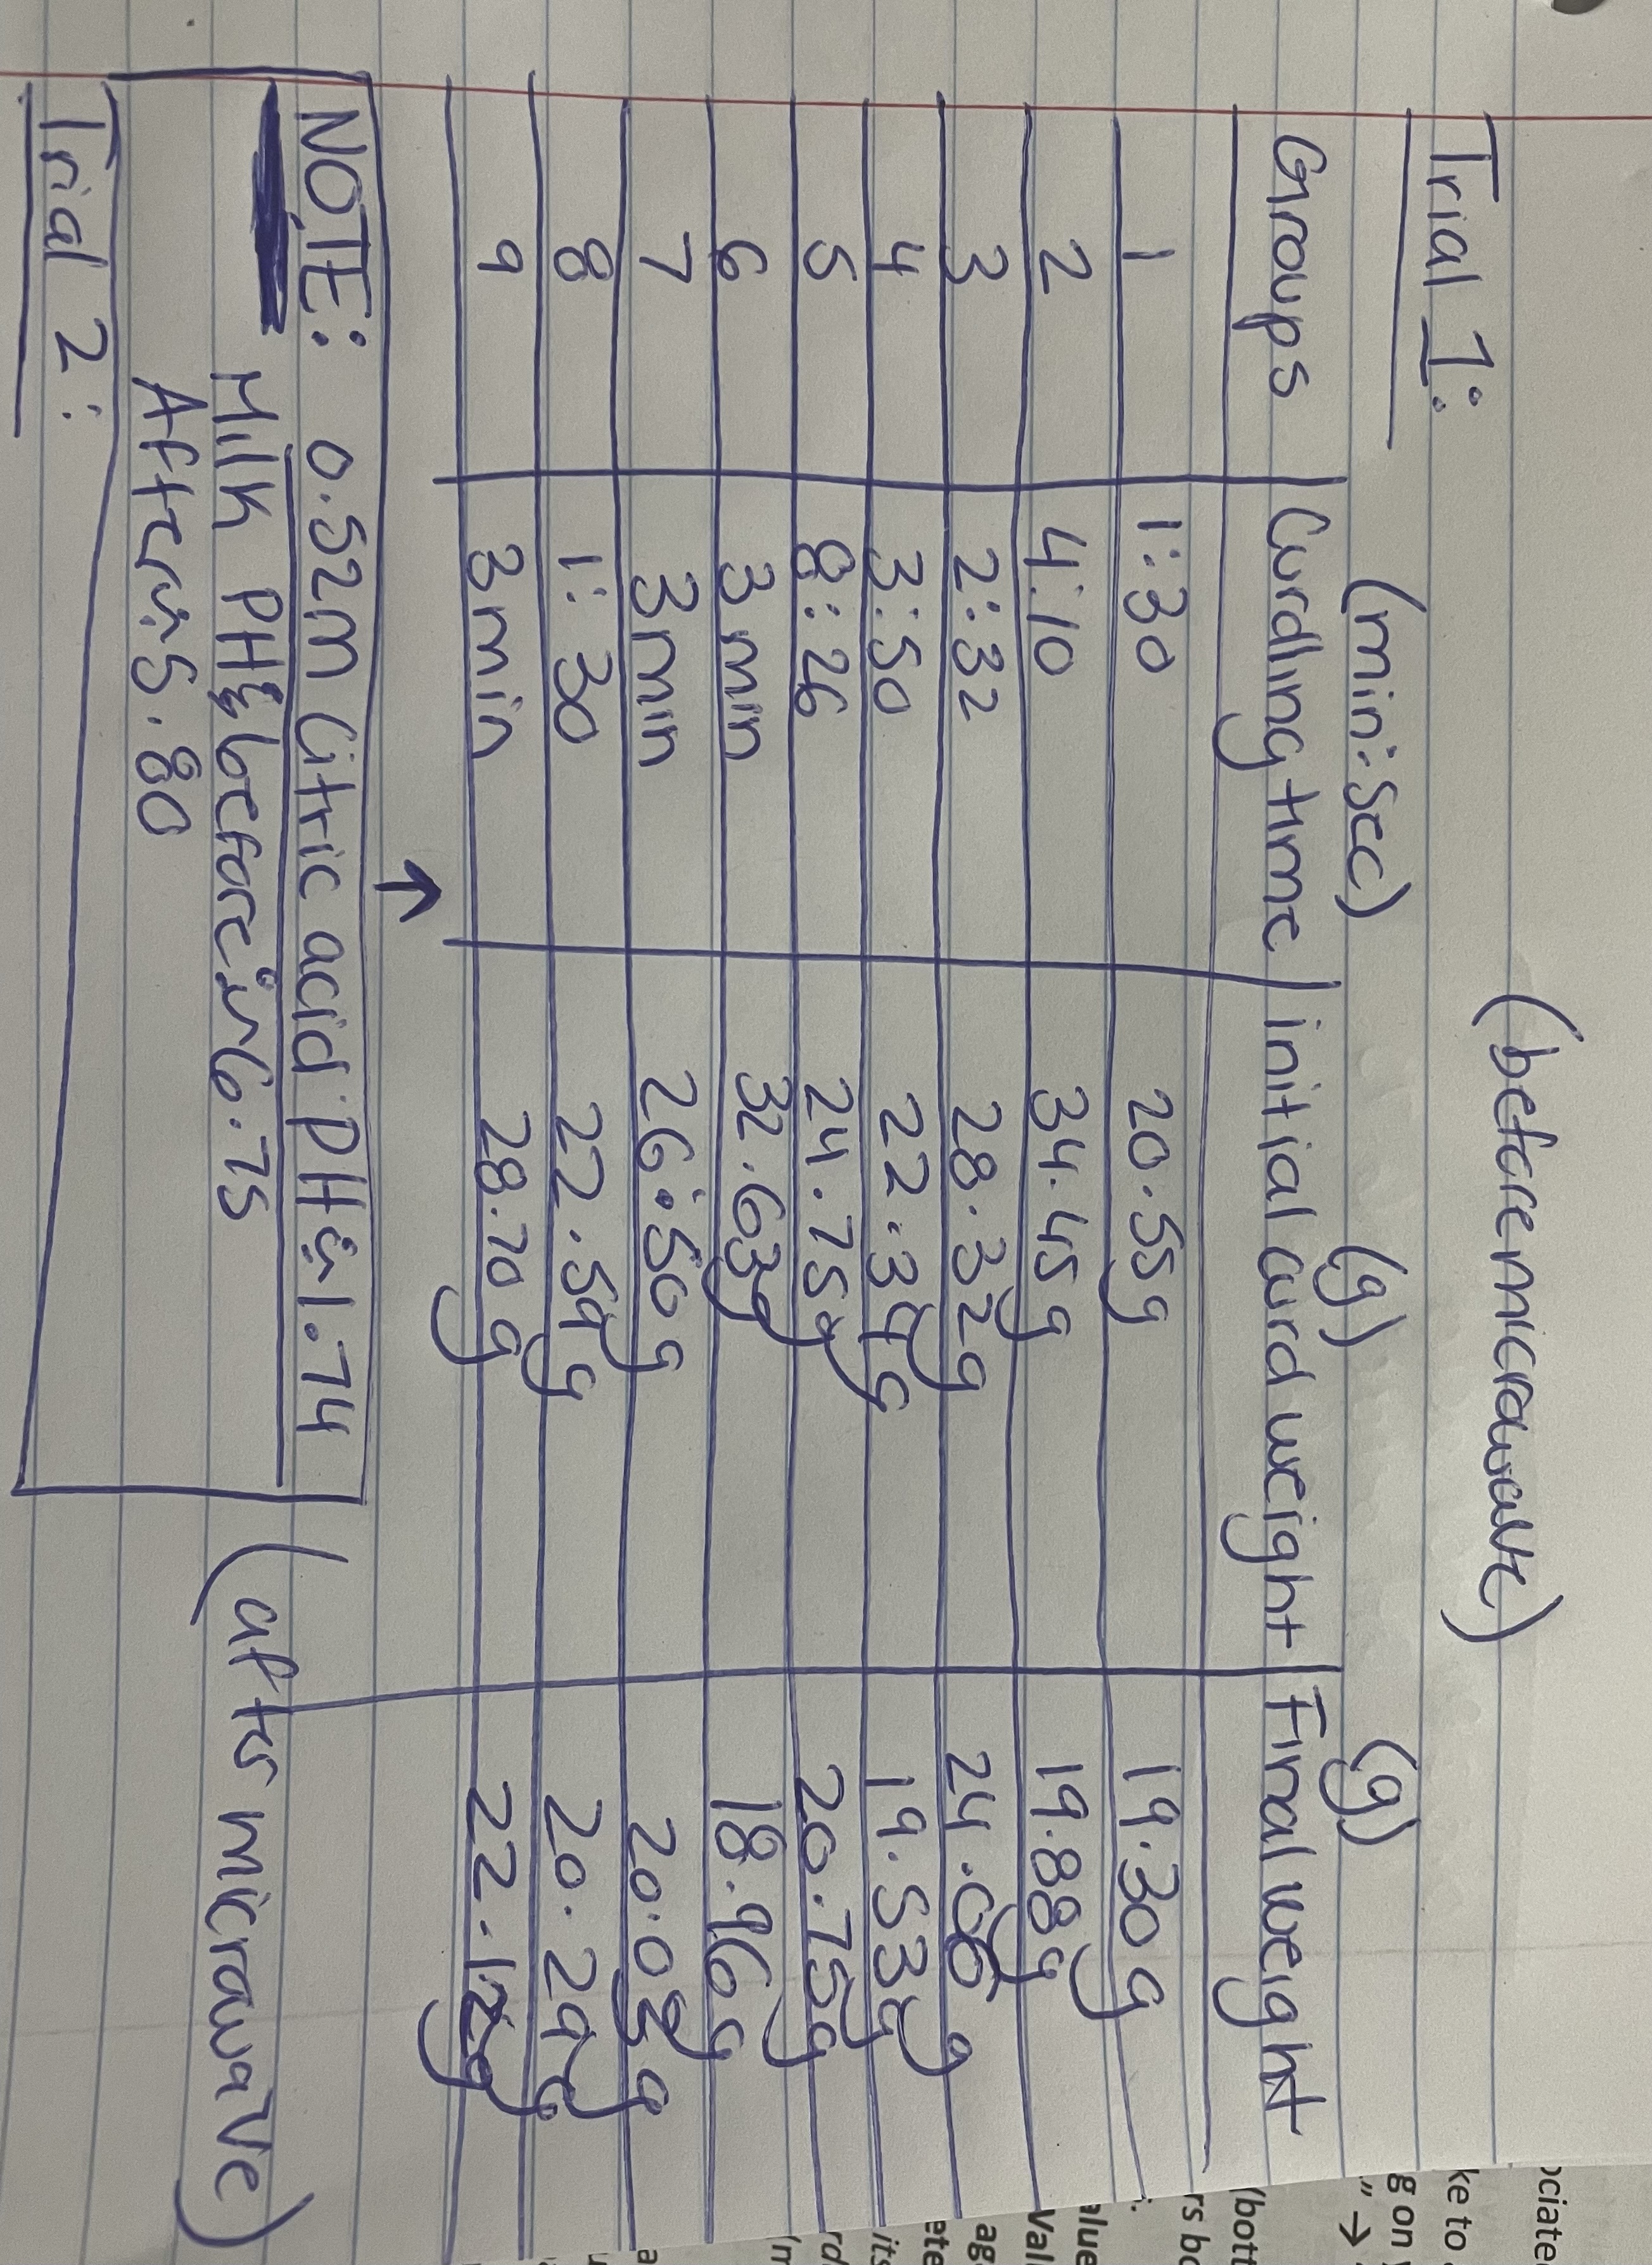
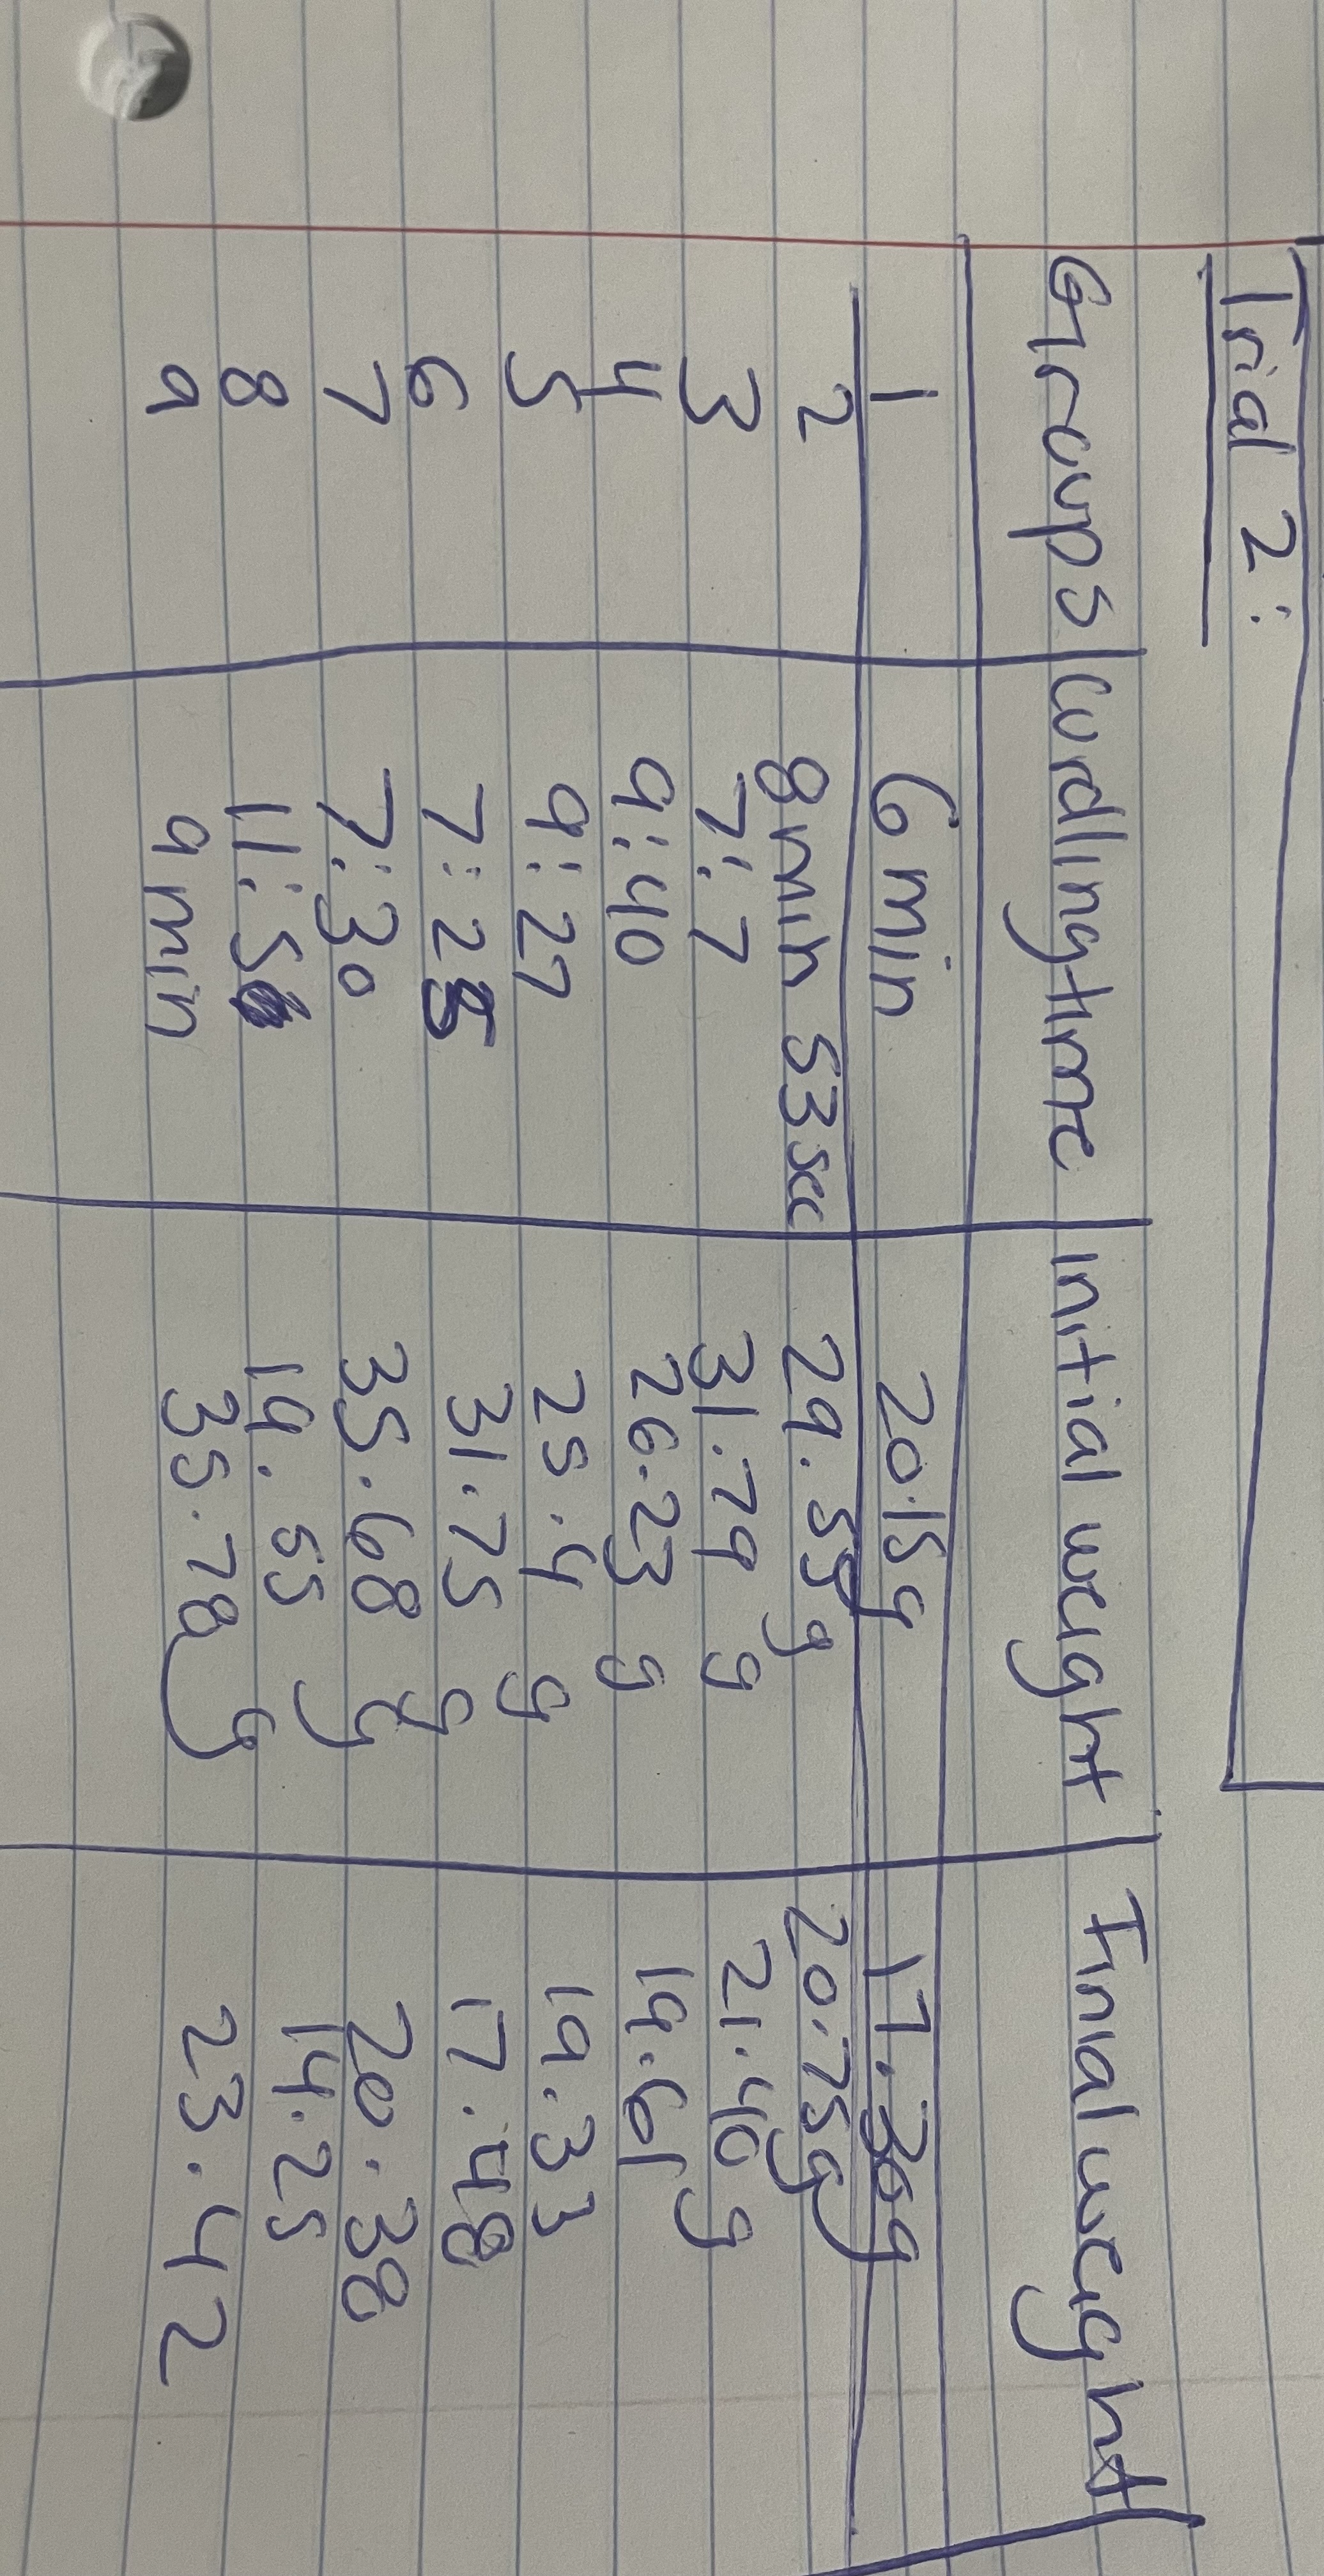
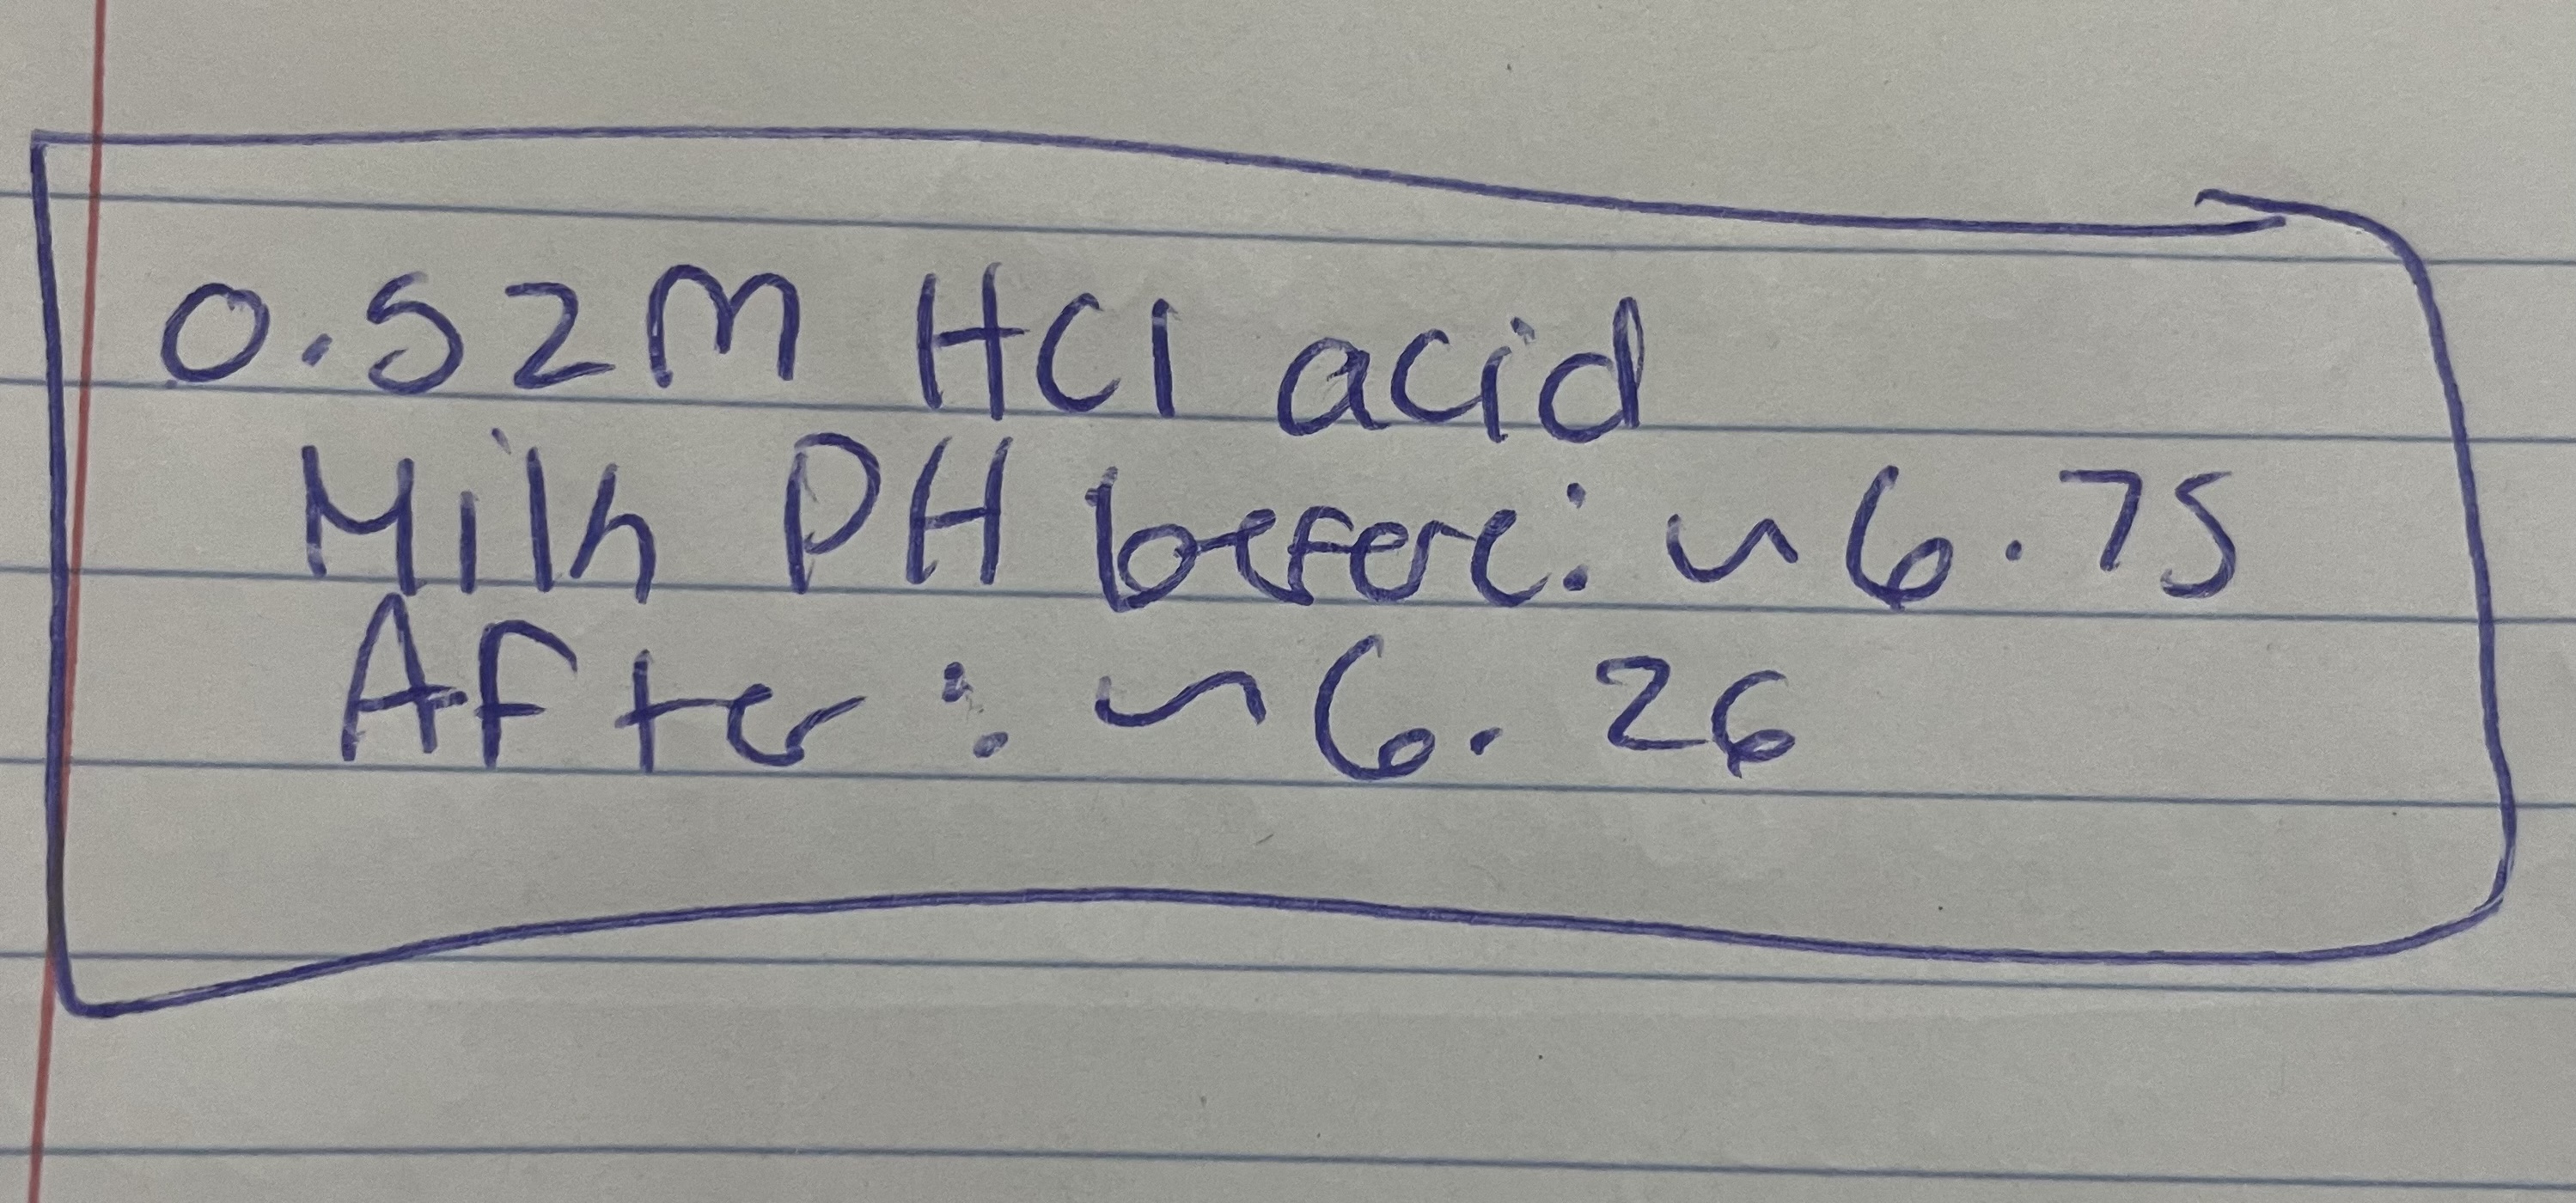
45 (adapt the table as needed based on the data). b. A statistical analysis of your data (2 marks): Calculate summary statistics in the form of a sample mean (average), standard deviation (SD), standard error of the mean (SE) and 95% confidence intervals (CI) using Microsoft Excel. Include these data in the table described under point (a) above. The descriptive statistics are summarized in the flow chart shown in figure 4 and they are explained on pages 28-30. C. Average curdling time and cheese weight graphs (5 marks total): Label your x- and y-axes appropriately based on the data collected. Two senStatistical analyses of data Mean (x) Standard Deviation Standard Error 95% Confidence The average of your (SD) (SE) Interval (CI) data points. Calculated An indication of how data Measures the Calculated using the SE by taking the sum of are spread around the accuracy with no value. It is your data ([ x;) and mean. This is also known as which a sample approximately double dividing by the number variability represents a the SE value and of data points (n). Example: Using the same population. extends above and X = Ex; values as shown for the To calculate SE you below the mean. Cl is n mean: must know the SD wider than the SE and Example: The heights of of the mean. provides a 95% chance plants (cm) after 30 Example: that true population SD = 2 (x, - x) 2 days of growth at 22 C n - 1 on of values yo mean would fall within SE = SD this range. Height 1 Height 2 Height 3 Height 4 SD = (3.0-2.6) + (2.6-2.6)2 + (3.2-2.6)+ (1,6-2.6) 3.0 2.6 3.2 1.6 4-1 n Example: SD = 0.40)2 + (0.00)2 + (0.60)2 + (1.00)2 SE = 0.71 CI = SE X 2 x = 3.0 + 2.6+ 3.2+1.6 4 - 1 CI = 0.35 x 2 SD = 0.16 + 0.00 + 0.36 + 1.00 CI = +0.7 SE = 0.71 x = 10.4 SD = 1.52 2 4 SE = 0.35 x = 2.6 SD = V 0.51 SD = 0.71 TenONISb Interpretation of data obtained via statistical analyses After running statistical analyses, you now proceed to observe trends within and between the different treatments. These data can tell you how the treatments may have affected the process being studioWhen considering the concept of data variability: the calculated mean value is always associated with an indication of the distribution of data points around that mean. This is the variability and SD is a measure of variability. Variability is due to a number of factors: . Every time we make a measurement, there will be a level of imprecision because we cannot always be 100% accurate with our measurements. Individual trials of an experiment will yield slightly different results even if they are testing the same thing. o Example: Different plants in a trial will naturally grow to a different height and also respond to a fertilizer treatment in a slightly different way. The variability of data is referred to as experimental error. This error is not a mistake, but a normal part of experimenting with biological organisms. Typically, scientists attempt to reduce experimental error by using precise measuring instruments, large sample sizes, and carrying out multiple replicates of an experiment. As you can see, examining only the sample mean will not tell you much about a data set. Although experimental error is not a mistake, variability cannot be ignored when analyzing data, so scientists use statistics to measure how confident they are with their measurements (how reliable the data are) and to highlight the trends revealed by the data. Standard error of the mean (SE) and 95% confidence intervals (CI) both provide an indication of how closely the sample mean estimates that of the whole population (not just the sample examined in the lab). The more measurements you make per treatment (the larger your sample size and the more replicates you have), the more reliable your sample mean is likely to be. When considering the concept of data reliability: When analyzing your graphical data, consider the size of the SE or CI bars. The larger the SE or CI bars for any given data point, the less confident you are about the reliability of your measurement and the less confident you can be about the overall trend of your data.Presenting mean and associated values in text: Within a written text, the mean must always be presented with the associated SD, SE or CI. Which is presented depends on what you are demonstrating you will present mean + CI. Rejecting or supporting the hypothesis: If your Cl bars do not overlap (statistical significance), the Ho is rejected. This means that the results are consistent with the alternate hypothesis (Ha) and not with the null hypothesis (Ho). If the CI bars overlap, then the Ho is not rejected, and the results are not consistent with the Ha. 29( before microwave ) ciate Trial 10 ke to (min : sec ) gon Groups Curdling time / initial curd weight Final weight bot 1:30 20. 55 9 19.30 9 4: 10 34. 45 9 19.88 9 2:32 28 . 329 24.06 ai 3:50 22 . 3 4 9 19 . 53 8:26 24. 75 9 20.75 9 3 min 32. 639 18.96 0 3 min 26: 50 9 20 08 Q 1: 30 22 . 59 9 20. 290 3 min 28.70 9 22. 129 NOTE: 0.52m Citric acid PHE 1. 74 Milk PHS before 6 . 75 after microwave Afters . 80 Trial 2 :Irial 2 : Groups curdling time initial weight Final weight 6 min 20.15 g 17. 309 8 min 53 sec 29. 55 g 20.75 9 7 7 31 .79 9 21. 40 9 9:40 26- 23 9 19. 61 9: 27 25. 4 19. 3 3 op 7:25 31. 75 17.48 7:30 35. 68 20. 38 19. 55 14.25 9 min 35. 78 23. 42\f
Step by Step Solution
There are 3 Steps involved in it
Step: 1
Get Instant Access to Expert-Tailored Solutions
See step-by-step solutions with expert insights and AI powered tools for academic success
Step: 2
Step: 3
Ace Your Homework with AI
Get the answers you need in no time with our AI-driven, step-by-step assistance