 Would you please help me calculate this assignment and explain the steps? Many thanks to the person who will help me with this assignment. Best regards
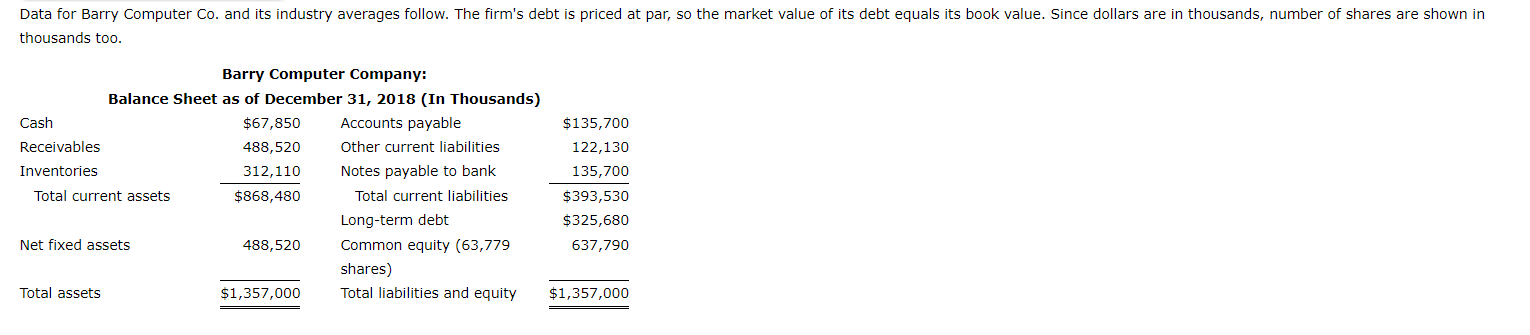
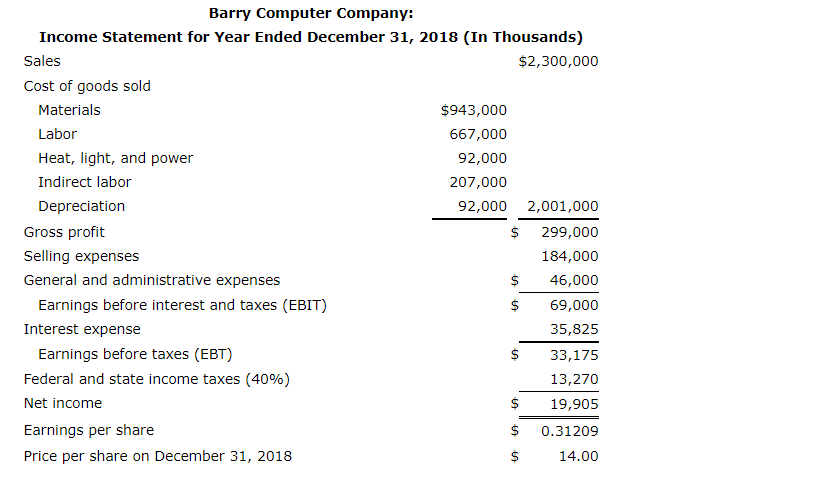
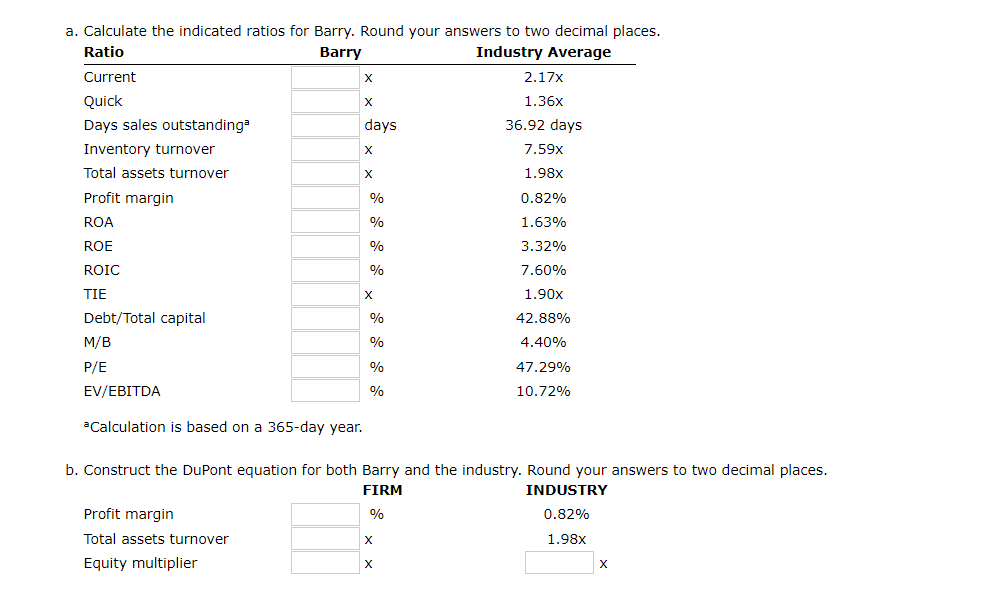
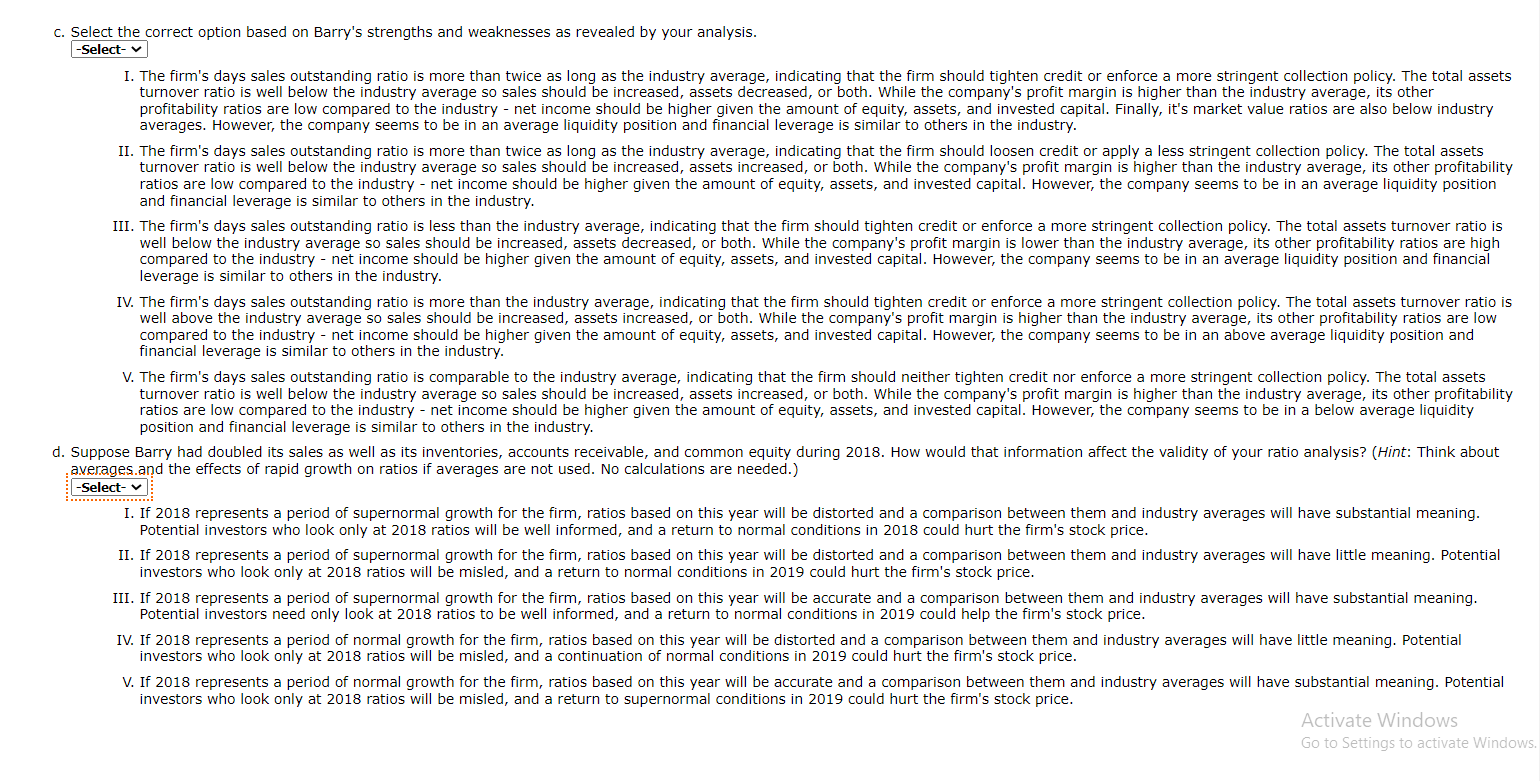
Data for Barry Computer Co. and its industry averages follow. The firm's debt is priced at par, so the market value of its debt equals its book value. Since dollars are in thousands, number of shares are shown in thousands too. Barry Computer Company: Balance Sheet as of December 31, 2018 (In Thousands) Cash $67,850 Accounts payable $135,700 Receivables 488,520 Other current liabilities 122,130 Inventories 312,110 Notes payable to bank 135,700 Total current assets $868,480 Total current liabilities $393,530 Long-term debt $325,680 Net fixed assets 488,520 Common equity (63,779 637,790 shares) Total assets $1,357,000 Total liabilities and equity $1,357,000 Barry Computer Company: Income Statement for Year Ended December 31, 2018 (In Thousands) Sales $2,300,000 Cost of goods sold Materials $943,000 Labor 667,000 Heat, light, and power 92,000 Indirect labor 207,000 Depreciation 92,000 2,001,000 Gross profit $ 299,000 Selling expenses 184,000 General and administrative expenses $ 46,000 Earnings before interest and taxes (EBIT) $ 69,000 Interest expense 35,825 Earnings before taxes (EBT) $ 33,175 Federal and state income taxes (40%) 13,270 Net income 19,905 Earnings per share 0.31209 Price per share on December 31, 2018 $ 14.00 $ $ $ a. Calculate the indicated ratios for Barry. Round your answers to two decimal places. Ratio Barry Industry Average Current X 2.17x Quick X 1.36x Days sales outstandinga days 36.92 days Inventory turnover 7.59x Total assets turnover X 1.98x Profit margin % 0.82% ROA % 1.63% ROE % 3.32% ROIC 7.60% TIE X 1.90x Debt/Total capital % 42.88% M/B % 4.40% P/E % 47.29% EV/EBITDA % 10.72% % a Calculation is based on a 365-day year. b. Construct the DuPont equation for both Barry and the industry. Round your answers to two decimal places. FIRM INDUSTRY Profit margin % 0.82% Total assets turnover X 1.98x Equity multiplier X C. Select the correct option based on Barry's strengths and weaknesses as revealed by your analysis. -Select- I. The firm's days sales outstanding ratio is more than twice as long as the industry average, indicating that the firm should tighten credit or enforce a more stringent collection policy. The total assets turnover ratio is well below the industry average so sales should be increased, assets decreased, or both. While the company's profit margin is higher than the industry average, its other profitability ratios are low compared to the industry - net income should be higher given the amount of equity, assets, and invested capital. Finally, it's market value ratios are also below industry averages. However, the company seems to be in an average liquidity position and financial leverage is similar to others in the industry. II. The firm's days sales outstanding ratio is more than twice as long as the industry average, indicating that the firm should loosen credit or apply a less stringent collection policy. The total assets turnover ratio is well below the industry average so sales should be increased, assets increased, or both. While the company's profit margin is higher than the industry average, its other profitability ratios are low compared to the industry - net income should be higher given the amount of equity, assets, and invested capital. However, the company seems to be in an average liquidity position and financial leverage is similar to others in the industry. III. The firm's days sales outstanding ratio is less than the industry average, indicating that the firm should tighten credit or enforce a more stringent collection policy. The total assets turnover ratio is well below the industry average so sales should be increased, assets decreased, or both. While the company's profit margin is lower than the industry average, its other profitability ratios are high compared to the industry - net income should be higher given the amount of equity, assets, and invested capital. However, the company seems to be in an average liquidity position and financial leverage is similar to others in the industry. IV. The firm's days sales outstanding ratio is more than the industry average, indicating that the firm should tighten credit or enforce a more stringent collection policy. The total assets turnover ratio is well above the industry average so sales should be increased, assets increased, or both. While the company's profit margin is higher than the industry average, its other profitability ratios are low compared to the industry - net income should be higher given the amount of equity, assets, and invested capital. However, the company seems to be in an above average liquidity position and financial leverage is similar to others in the industry. V. The firm's days sales outstanding ratio is comparable to the industry average, indicating that the firm should neither tighten credit nor enforce a more stringent collection policy. The total assets turnover ratio is well below the industry average so sales should be increased, assets increased, or both. While the company's profit margin is higher than the industry average, its other profitability ratios are low compared to the industry - net income should be higher given the amount of equity, assets, and invested capital. However, the company seems to be in a below average liquidity position and financial leverage is similar to others in the industry. d. Suppose Barry had doubled its sales as well as its inventories, accounts receivable, and common equity during 2018. How would that information affect the validity of your ratio analysis? (Hint: Think about averages.and the effects of rapid growth on ratios if averages are not used. No calculations are needed.) -Select- I. If 2018 represents a period of supernormal growth for the firm, ratios based on this year will be distorted and a comparison between them and industry averages will have substantial meaning. Potential investors who look only at 2018 ratios will be well informed, and a return to normal conditions in 2018 could hurt the firm's stock price. II. If 2018 represents a period of supernormal growth for the firm, ratios based on this year will be distorted and a comparison between them and industry averages will have little meaning. Potential investors who look only at 2018 ratios will be misled, and a return to normal conditions in 2019 could hurt the firm's stock price. III. If 2018 represents a period of supernormal growth for the firm, ratios based on this year will be accurate and a comparison between them and industry averages will have substantial meaning. Potential investors need only look at 2018 ratios to be well informed, and a return to normal conditions in 2019 could help the firm's stock price. IV. If 2018 represents a period of normal growth for the firm, ratios based on this year will be distorted and a comparison between them and industry averages will have little meaning. Potential investors who look only at 2018 ratios will be misled, and a continuation of normal conditions in 2019 could hurt the firm's stock price. V. If 2018 represents a period of normal growth for the firm, ratios based on this year will be accurate and a comparison between them and industry averages will have substantial meaning. Potential investors who look only at 2018 ratios will be misled, and a return to supernormal conditions in 2019 could hurt the firm's stock price. Activate Windows Go to Settings to activate Windows. Data for Barry Computer Co. and its industry averages follow. The firm's debt is priced at par, so the market value of its debt equals its book value. Since dollars are in thousands, number of shares are shown in thousands too. Barry Computer Company: Balance Sheet as of December 31, 2018 (In Thousands) Cash $67,850 Accounts payable $135,700 Receivables 488,520 Other current liabilities 122,130 Inventories 312,110 Notes payable to bank 135,700 Total current assets $868,480 Total current liabilities $393,530 Long-term debt $325,680 Net fixed assets 488,520 Common equity (63,779 637,790 shares) Total assets $1,357,000 Total liabilities and equity $1,357,000 Barry Computer Company: Income Statement for Year Ended December 31, 2018 (In Thousands) Sales $2,300,000 Cost of goods sold Materials $943,000 Labor 667,000 Heat, light, and power 92,000 Indirect labor 207,000 Depreciation 92,000 2,001,000 Gross profit $ 299,000 Selling expenses 184,000 General and administrative expenses $ 46,000 Earnings before interest and taxes (EBIT) $ 69,000 Interest expense 35,825 Earnings before taxes (EBT) $ 33,175 Federal and state income taxes (40%) 13,270 Net income 19,905 Earnings per share 0.31209 Price per share on December 31, 2018 $ 14.00 $ $ $ a. Calculate the indicated ratios for Barry. Round your answers to two decimal places. Ratio Barry Industry Average Current X 2.17x Quick X 1.36x Days sales outstandinga days 36.92 days Inventory turnover 7.59x Total assets turnover X 1.98x Profit margin % 0.82% ROA % 1.63% ROE % 3.32% ROIC 7.60% TIE X 1.90x Debt/Total capital % 42.88% M/B % 4.40% P/E % 47.29% EV/EBITDA % 10.72% % a Calculation is based on a 365-day year. b. Construct the DuPont equation for both Barry and the industry. Round your answers to two decimal places. FIRM INDUSTRY Profit margin % 0.82% Total assets turnover X 1.98x Equity multiplier X C. Select the correct option based on Barry's strengths and weaknesses as revealed by your analysis. -Select- I. The firm's days sales outstanding ratio is more than twice as long as the industry average, indicating that the firm should tighten credit or enforce a more stringent collection policy. The total assets turnover ratio is well below the industry average so sales should be increased, assets decreased, or both. While the company's profit margin is higher than the industry average, its other profitability ratios are low compared to the industry - net income should be higher given the amount of equity, assets, and invested capital. Finally, it's market value ratios are also below industry averages. However, the company seems to be in an average liquidity position and financial leverage is similar to others in the industry. II. The firm's days sales outstanding ratio is more than twice as long as the industry average, indicating that the firm should loosen credit or apply a less stringent collection policy. The total assets turnover ratio is well below the industry average so sales should be increased, assets increased, or both. While the company's profit margin is higher than the industry average, its other profitability ratios are low compared to the industry - net income should be higher given the amount of equity, assets, and invested capital. However, the company seems to be in an average liquidity position and financial leverage is similar to others in the industry. III. The firm's days sales outstanding ratio is less than the industry average, indicating that the firm should tighten credit or enforce a more stringent collection policy. The total assets turnover ratio is well below the industry average so sales should be increased, assets decreased, or both. While the company's profit margin is lower than the industry average, its other profitability ratios are high compared to the industry - net income should be higher given the amount of equity, assets, and invested capital. However, the company seems to be in an average liquidity position and financial leverage is similar to others in the industry. IV. The firm's days sales outstanding ratio is more than the industry average, indicating that the firm should tighten credit or enforce a more stringent collection policy. The total assets turnover ratio is well above the industry average so sales should be increased, assets increased, or both. While the company's profit margin is higher than the industry average, its other profitability ratios are low compared to the industry - net income should be higher given the amount of equity, assets, and invested capital. However, the company seems to be in an above average liquidity position and financial leverage is similar to others in the industry. V. The firm's days sales outstanding ratio is comparable to the industry average, indicating that the firm should neither tighten credit nor enforce a more stringent collection policy. The total assets turnover ratio is well below the industry average so sales should be increased, assets increased, or both. While the company's profit margin is higher than the industry average, its other profitability ratios are low compared to the industry - net income should be higher given the amount of equity, assets, and invested capital. However, the company seems to be in a below average liquidity position and financial leverage is similar to others in the industry. d. Suppose Barry had doubled its sales as well as its inventories, accounts receivable, and common equity during 2018. How would that information affect the validity of your ratio analysis? (Hint: Think about averages.and the effects of rapid growth on ratios if averages are not used. No calculations are needed.) -Select- I. If 2018 represents a period of supernormal growth for the firm, ratios based on this year will be distorted and a comparison between them and industry averages will have substantial meaning. Potential investors who look only at 2018 ratios will be well informed, and a return to normal conditions in 2018 could hurt the firm's stock price. II. If 2018 represents a period of supernormal growth for the firm, ratios based on this year will be distorted and a comparison between them and industry averages will have little meaning. Potential investors who look only at 2018 ratios will be misled, and a return to normal conditions in 2019 could hurt the firm's stock price. III. If 2018 represents a period of supernormal growth for the firm, ratios based on this year will be accurate and a comparison between them and industry averages will have substantial meaning. Potential investors need only look at 2018 ratios to be well informed, and a return to normal conditions in 2019 could help the firm's stock price. IV. If 2018 represents a period of normal growth for the firm, ratios based on this year will be distorted and a comparison between them and industry averages will have little meaning. Potential investors who look only at 2018 ratios will be misled, and a continuation of normal conditions in 2019 could hurt the firm's stock price. V. If 2018 represents a period of normal growth for the firm, ratios based on this year will be accurate and a comparison between them and industry averages will have substantial meaning. Potential investors who look only at 2018 ratios will be misled, and a return to supernormal conditions in 2019 could hurt the firm's stock price. Activate Windows Go to Settings to activate Windows