

Question: Write a Mathlab program that can solve for the flow rate distribution in a network of pipes using the Hardy Cross Method. The program has
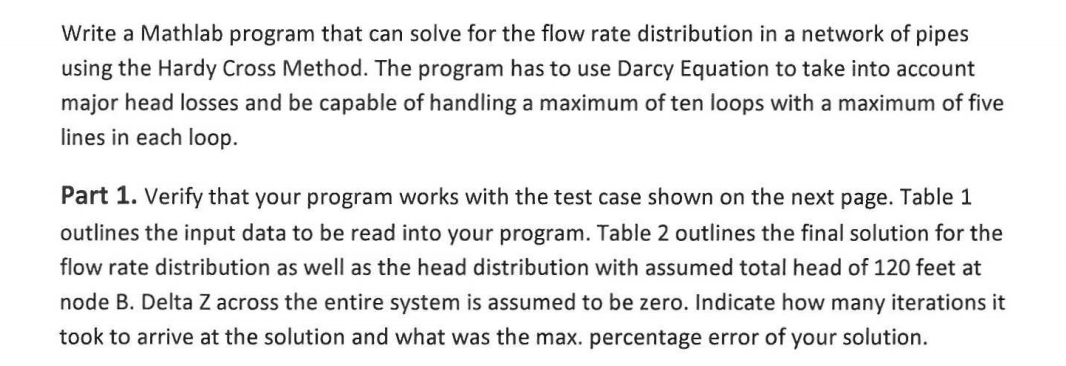
Write a Mathlab program that can solve for the flow rate distribution in a network of pipes using the Hardy Cross Method. The program has to use Darcy Equation to take into account major head losses and be capable of handling a maximum of ten loops with a maximum of five lines in each loop. Part 1. Verify that your program works with the test case shown on the next page. Table 1 outlines the input data to be read into your program. Table 2 outlines the final solution for the flow rate distribution as well as the head distribution with assumed total head of 120 feet at node B. Delta Z across the entire system is assumed to be zero. Indicate how many iterations it took to arrive at the solution and what was the max. percentage error of your solution. 2.4 cfs 2.1 cfs 1.6 1.0 1.4 cfs Cast Iron Pipe 9 E = 0.00085 pt V = 1.082 x 10 ? Loop! 0.4 Loep 3 1.0 Y 1.5 B 2210 10.8 cts 1.4 cts 3.0 1.8 S-12 +1 = 3 0 0. Loop 2 select: : 3.8 Q.BA = -40 Rs OBC= =+3.8 cts + 2.1 cfs Q = -1.5 cts A typical three-loop network. TABLE 2 TABLE 1 Loop Node Line No. No. Loop Line No. No. Swamee-Jain Q H (cfs) (it) Diameter Q() (in.) (cfs) Length (ft) 1 1 2 3 4 10560 15840 10560 15840 16 12 14 16 1 3.0 1.5 -1.6 -4.0 1 2 3 4 E H A B 3.780 1.508 -1.640 -4.040 120.000 102.902 84.085 90.816 120.000 1 2 ON 15840 13200 10560 10560 16 14 12 16 2 3.8 1.7 0.3 -3.0 B D E B 1 2 3 4 2.980 0.880 --0.520 -3.780 120.000 103.823 101.244 102.902 120.000 4 3 1 2 3 4 15840 15840 15840 15840 12 10 12 12 1.8 0.4 -1.0 -1.5 3 E F G H E 2 3 4 1.753 0.353 -1.047 -1.508 102.902 77.730 74.734 84.085 102.902 Write a Mathlab program that can solve for the flow rate distribution in a network of pipes using the Hardy Cross Method. The program has to use Darcy Equation to take into account major head losses and be capable of handling a maximum of ten loops with a maximum of five lines in each loop. Part 1. Verify that your program works with the test case shown on the next page. Table 1 outlines the input data to be read into your program. Table 2 outlines the final solution for the flow rate distribution as well as the head distribution with assumed total head of 120 feet at node B. Delta Z across the entire system is assumed to be zero. Indicate how many iterations it took to arrive at the solution and what was the max. percentage error of your solution. 2.4 cfs 2.1 cfs 1.6 1.0 1.4 cfs Cast Iron Pipe 9 E = 0.00085 pt V = 1.082 x 10 ? Loop! 0.4 Loep 3 1.0 Y 1.5 B 2210 10.8 cts 1.4 cts 3.0 1.8 S-12 +1 = 3 0 0. Loop 2 select: : 3.8 Q.BA = -40 Rs OBC= =+3.8 cts + 2.1 cfs Q = -1.5 cts A typical three-loop network. TABLE 2 TABLE 1 Loop Node Line No. No. Loop Line No. No. Swamee-Jain Q H (cfs) (it) Diameter Q() (in.) (cfs) Length (ft) 1 1 2 3 4 10560 15840 10560 15840 16 12 14 16 1 3.0 1.5 -1.6 -4.0 1 2 3 4 E H A B 3.780 1.508 -1.640 -4.040 120.000 102.902 84.085 90.816 120.000 1 2 ON 15840 13200 10560 10560 16 14 12 16 2 3.8 1.7 0.3 -3.0 B D E B 1 2 3 4 2.980 0.880 --0.520 -3.780 120.000 103.823 101.244 102.902 120.000 4 3 1 2 3 4 15840 15840 15840 15840 12 10 12 12 1.8 0.4 -1.0 -1.5 3 E F G H E 2 3 4 1.753 0.353 -1.047 -1.508 102.902 77.730 74.734 84.085 102.902
Step by Step Solution
There are 3 Steps involved in it

Get step-by-step solutions from verified subject matter experts