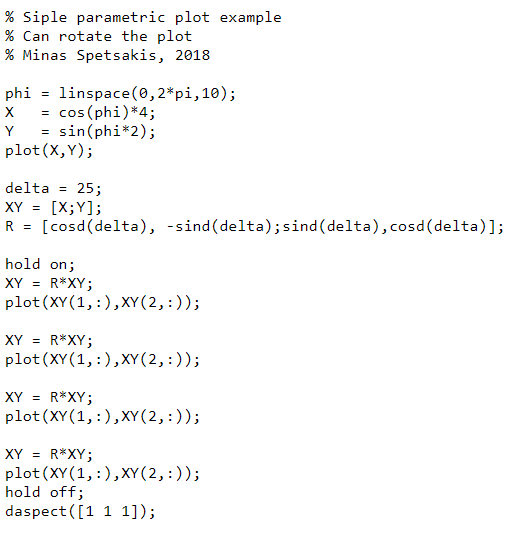

Write a Matlab script that creates a plot with six little circles of diameter 2 whose centers are radius units away from the origin (point [0, 0]) and in the directions 0, 60, 120, 180, 240, and 300 degrees from the X axis like this image. The little circles have colors red, green, blue, yellow, magenta, and cyan respectively. Name your script bubbles.m and plotted with nump points. The script starts with a header (brief description, name of author and date), assignments to variables nump and radius (120 and 3 are good numbers for this) and then the instructions to create the plots and plot them. Use file paraplot.m for inspiration. Make sure the circles look like circles when plotted and not like ellipses. % Siple parametric plot example % Can rotate the plot % Minas Spetsakis, 2018 phi linspace(0,2*pi, 10); cos(phi)*4; Y sin(phi*2); plot(X,Y); 25; delta = XY = [X;Y]; R = [cosd(delta), -sind (delta); sind (delta), cosd(delta)]; hold on; XY = R*XY; plot(XY(1,:),XY(2,:)); XY = R*XY; plot(XY(1,:),XY(2,:)); XY R*XY; plot(XY(1,:),XY(2,:)); XY = R*XY; plot(XY(1,:),XY(2,:)); hold off; daspect([1 1 1]); Write a Matlab script that creates a plot with six little circles of diameter 2 whose centers are radius units away from the origin (point [0, 0]) and in the directions 0, 60, 120, 180, 240, and 300 degrees from the X axis like this image. The little circles have colors red, green, blue, yellow, magenta, and cyan respectively. Name your script bubbles.m and plotted with nump points. The script starts with a header (brief description, name of author and date), assignments to variables nump and radius (120 and 3 are good numbers for this) and then the instructions to create the plots and plot them. Use file paraplot.m for inspiration. Make sure the circles look like circles when plotted and not like ellipses. % Siple parametric plot example % Can rotate the plot % Minas Spetsakis, 2018 phi linspace(0,2*pi, 10); cos(phi)*4; Y sin(phi*2); plot(X,Y); 25; delta = XY = [X;Y]; R = [cosd(delta), -sind (delta); sind (delta), cosd(delta)]; hold on; XY = R*XY; plot(XY(1,:),XY(2,:)); XY = R*XY; plot(XY(1,:),XY(2,:)); XY R*XY; plot(XY(1,:),XY(2,:)); XY = R*XY; plot(XY(1,:),XY(2,:)); hold off; daspect([1 1 1])


