

Answered step by step
Verified Expert Solution
Question
1 Approved Answer
write a MATLAB/PAYTHON code for this DATASET LABEL case Engine Speed (cycle average); Part Engine BMEP - Brake Mean Effective Pressure; Part Engine BSFC -
write a MATLAB/PAYTHON code for this
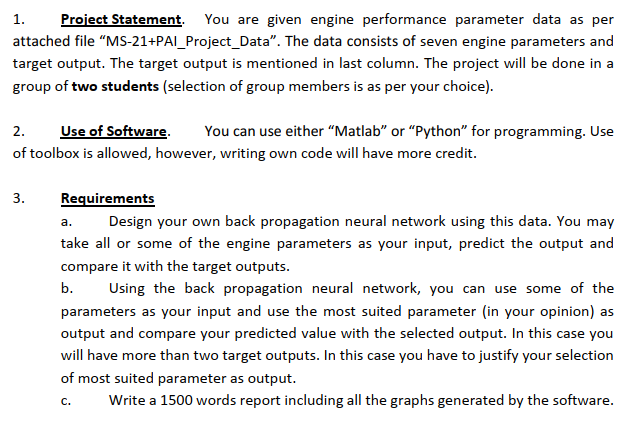
DATASET
| LABEL | case | Engine Speed (cycle average); Part Engine | BMEP - Brake Mean Effective Pressure; Part Engine | BSFC - Brake Specific Fuel Consumption; Part Engine | Indicated Efficiency; Part Engine | Brake Efficiency; Part Engine | Brake Torque; Part Engine | Brake Power (HP); Part Engine | target | ||
| 1.00 | 14.70 | 6000.00 | -5.25 | 0.00 | 0.00 | 0.00 | -131.27 | -110.61 | 1.00 | ||
| 2.00 | 14.70 | 6000.00 | -2.43 | -303.46 | 3.55 | -27.14 | -60.73 | -51.17 | 1.00 | ||
| 3.00 | 14.70 | 6000.00 | 2.39 | 550.27 | 32.55 | 14.97 | 59.70 | 50.30 | 1.00 | ||
| 4.00 | 14.70 | 6000.00 | 4.59 | 366.11 | 36.60 | 22.50 | 114.85 | 96.77 | 1.00 | ||
| 5.00 | 14.70 | 6000.00 | 5.24 | 333.41 | 38.47 | 24.71 | 130.93 | 110.32 | 1.00 | ||
| 6.00 | 14.70 | 6000.00 | 5.37 | 329.58 | 38.62 | 24.99 | 134.30 | 113.16 | 1.00 | ||
| 7.00 | 14.70 | 6000.00 | 5.41 | 328.17 | 38.70 | 25.10 | 135.23 | 113.94 | 1.00 | ||
| 8.00 | 14.70 | 6000.00 | 5.41 | 327.84 | 38.73 | 25.13 | 135.37 | 114.06 | 1.00 | ||
| 9.00 | 14.70 | 6000.00 | 5.41 | 327.83 | 38.73 | 25.13 | 135.37 | 114.06 | 1.00 |
Step by Step Solution
There are 3 Steps involved in it
Step: 1

Get Instant Access to Expert-Tailored Solutions
See step-by-step solutions with expert insights and AI powered tools for academic success
Step: 2

Step: 3
Ace Your Homework with AI
Get the answers you need in no time with our AI-driven, step-by-step assistance
Get Started
Intranet And Web Databases For Dummies
Authors: Paul Litwin
1st Edition
0764502212, 9780764502217