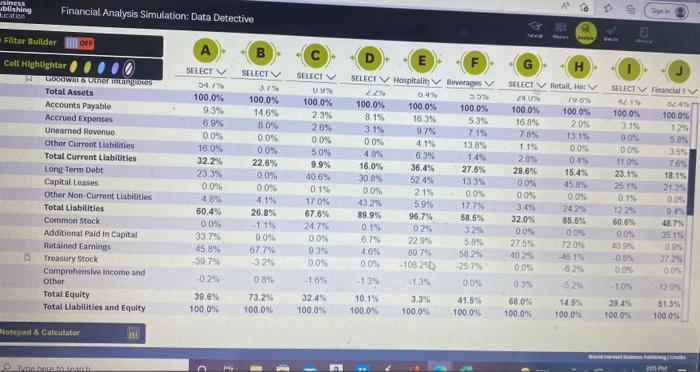
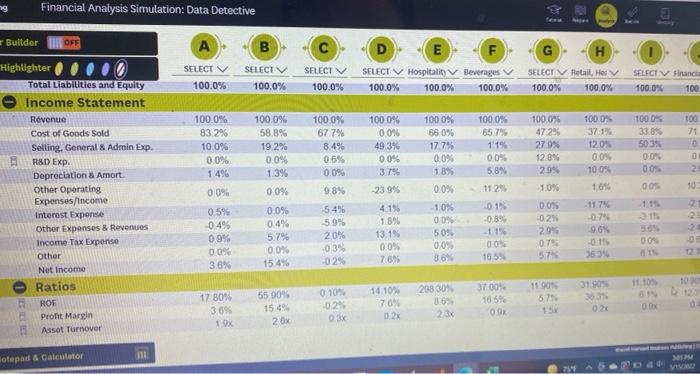
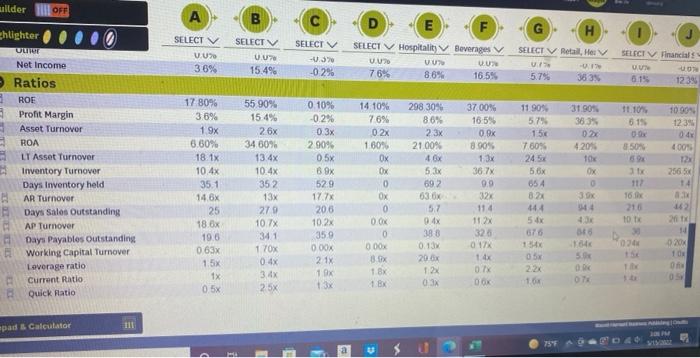
write a short rationale for your decision and finally express a "confidence percentage" of your selections. The ten industries are: Mass Media & Information, Petroleum, Airline, Financial Services, Hospitality, Robots, Fashion, Home Improvement Supply Retail, Beverages, and Retail & Healthcare. 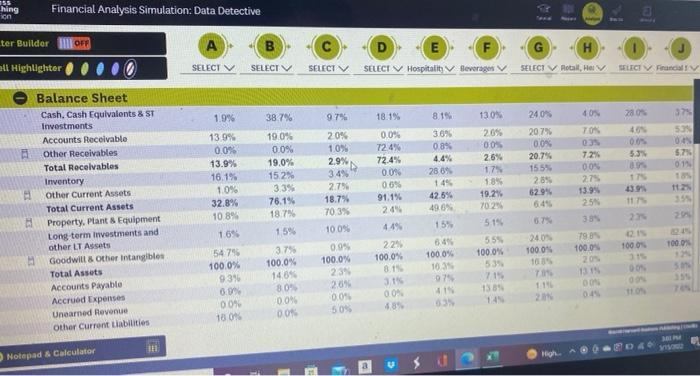
hing ion Financial Analysis Simulation: Data Detective ter Builder OFF E F SELECT Hospitality Beverages e Highlighter SELECTV SELECTV SELECTV SELECT Rotall, Helv SELECT Fundial 37 1.9% 18.1% 2004 40 53 5.3% 8.15 36% 08% 4.4% 2809 14% 42.5% 496 38.7% 19.0% 0.0% 19.0% 15.2% 335 76.1% 18.7% 15% 3.75 100.0% Balance Sheet Cash, Cash Equivalents & ST Investments Accounts Receivable Other Receivables Total Receivables Inventory Other Current Assets Total Current Assets Property. Plant & Equipment Long-term investments and other LT Assets Goodwill & other intangibles Total Assets Accounts Payable Accrued Expenses Unearned Revenue Other Current Liabilities 97% 20% 10% 2.9% 3.4% 2.750 18.7% 703% 100% 240% 2079 0.0% 20.7% 155% 285 62.9% 6.45 04 5.7 01 130% 20% 00% 26% 17% 18% 19.25 70:25 519 40% TON ON 7.296 00% 27 13 99 25 33 139 11 13.9% 0.0% 13.9% 16.1% 10% 32.8% 10.8% 169 54 75 100.0% 93 0.9 004 18 0 0.0% 72.8% 72.4% 0.0% 0.6% 91.1% 249 449 221 100.0% 81 31 0 0 685 35 20 79 100.0% 0.99 100.0% 100.0 15% 86 100.0% 163 07 415 18 1000% 3 55% 100.0% 53 715 1389 240 1000 101 7 111 21 131 ON 1484 80" 00 00 209 004 50% 46 Notepad & Calculator High usiness ublishing kati Financial Analysis Simulation: Data Detective AN EP S # Filter Builder | OP A SELECTV F SELECT Call Highlighter H COROWTuner images Total Assets Accounts Payable Accrued Exponses Unearned Revenue Other Current Liabilities Total Current Liabilities Long-Term Debt Capital Leases Other Non-Current Liabilities Total Liabilities Common Stock Additional Paid in Capital Hotained Earnings Treasury Stock Comprehensive Income and Other Total Equity Total Liabilities and Equity 100.0% 9.3% 6.9% 00% 16.0% 32.2% 23.3% 0.0% 48% 60.4% 0.0% 33.7% 45 8% -39 79 SELECTV 3.1 100.0% 14.6% 80% 0.0% 00% 22.6% 00% 00% 4.1% 26.8% 11% 9.0% 67.7 32 0.3% 73.2% 100.0% 100.0% 23% 26% 00% 5.0% 9.9% 40.6% 0.1% 17 0% 67.6% 24.7% 0.0% 93% 0.0% SELECI V Hospitality Beverages 2.29 04% 55 100.0% 100.0% 100.0% 8.1% 16.3% 53% 3.1% 97% 719 0.0% 41% 138% 48% 83% 14% 16.0% 36.4% 27.5% 30.8% 52.4% 13.3% 0.0% 21% 0.09 43.2% 5.9% 177% 89.9% 96.7% $8.5% 0.1% 0.24 3.29 6.7% 22.99 58% 469 80.7% 58:25 0.0 -10829 257 -13% 13 00 10.1% 3.3% 41.5% 100.0% 100.0% 100.0% H SELECT Retail, Hes 16 100.0% 100.0% 16 89 20% 78% 131% 11% 0096 28% 0.49 28.6% 15.4% 0.0% 458% 00% 0.0% 3.4 202 32.0% 85.6% 00 O ON 275 7209 46.1 0.0% 52 0391 52 68.0% 14.5% 100.0% 100.0% SELECTV Financial BEN 100.0% 100.0 3.15 12% 53% 0:09 3.59 11 0 76 23.15 18.15 2519 25 % 0.15 00 122 9.49 50.6% 48.7% 0.0% 3515 10.95 2729 00% 009 -10 12096 602 05 -16% 02% 39.6% 100.0% 32.4% 100.0% 51,395 100.0% 100.0% Notepad a Calculator Danh PU ng Financial Analysis Simulation: Data Detective Builder OFF B F G H A SELECT 100.0% SELECTV 100.0% SELECTV 100.0% E SELECT Hospitality 100.0% 100.0% Beverages 100.0% SELECT V Retail, Hes 100.0% 100.0% SELECT V Finance 100.0% 100 100 0% 00% 100.0% 58.8% 19.2% 0.0% 139 1000% 67.7% 8.4% 0.6% 0.0% 98% 49.3% 0.0% 100.0% 66.0% 177% 00% 1.8% 00% 100.0% 65.7% 119 0.0% 589 100.0% 4725 279% 12.8% 29% 100.0% 37.1% 12.05 0.0% 100 169 1000% 33.8% 5035 00% 00% 00 8 KOON 100.0% 83 296 100% 0.0% 1.496 0.0% 0.5% 0.4% 0.9% 0.0% 3.8% 0 0% -23 9% 112% -10% Highlighter Total Liabilities and Equity Income Statement Revenue Cost of Goods Sold Selling. General & Admin Exp. R&D Exp. Depreciation & Amort. Other Operating Expenses/income Interest Expense Other Expenses & Revenues Income Tax Expense Other Net Income Ratios ROF Pront Margin Asset Turnover 1.1" 0.0% 0.4% 5.79 0.0% 15.4% -54% 59% 20% 0:39 0.2 4.1% 1896 13.15 0.0% 7.6% -10% 00 50% 00 013 0.89 11 00 165 00% 029 29 0.79 57 11.7% 07 9.6% 015 38.34 86% 3100% 11 10 17 80% 30% 1 x 55 90% 15.4 2x 1190 575 14.10% 70% 024 0.10% 0.29 0.3% 208 30% 30 23 37.00% 10.5 OK DI otepad & Calculator M aillder I OFF A m G ghlighter H SELECT V SELECT V Uue Beverages VU 36% UU 15.4% SELECT -0.37 -0.2% SELECT Hospitality VU 76% 8.6% SELECT V Retail, Hei - 575 353 SELECT Financial UUT 0 1239 16.5% 298 30% 8.6% 100 3700% 16.5% 0.OK 8 90% 11.10% 615 1239 2 3% 3.50 Net Income Ratios 8 ROE Profit Margin Asset Turnover ROA LT Asset Turnover Inventory Turnover Days Inventory held HAR Turnover Days Sales Outstanding AP Turnover Days Payables Outstanding Working Capital Turnover Loverage ratio Current Ratio Quick Ratio 36.7% 17 80% 3.6% 1 9x 6,60% 18. 1x 10.4x 35.1 14.6% 25 18 0x 19.6 0.63% 1.5% 1x 0.5x 55 90% 15.4% 26x 34 60% 13 4x 10.4% 352 13x 279 10.7% 341 1 TOX 0.4% 3. 4x 25x 99 0.10% -0.2% 0.3% 2 90% 0.5x 6.9x 529 17.7% 206 10. 2x 359 0.00% 2.1% 10x 13 14 10% 76% 02x 1 60% Ox Ox 0 0 0.04 0 000x 3.5X 1 BX 1 BX 11 90% 579 1:50 760% 24.53 5.6 654 824 444 50x 67 31 90% 353 024 4209 to OX 0 3 44 21.00% 4 BX 5.3% 692 63.0 5.7 0.4% 388 0.13 2004 400% 12 25656 14 . 162 2011 32% 16. 210 10 020 11 2x 320 017 1 x 0.1% DO 0202 10 TI 2.24 100 0 OT 03 pad & Calculator 753 hing ion Financial Analysis Simulation: Data Detective ter Builder OFF E F SELECT Hospitality Beverages e Highlighter SELECTV SELECTV SELECTV SELECT Rotall, Helv SELECT Fundial 37 1.9% 18.1% 2004 40 53 5.3% 8.15 36% 08% 4.4% 2809 14% 42.5% 496 38.7% 19.0% 0.0% 19.0% 15.2% 335 76.1% 18.7% 15% 3.75 100.0% Balance Sheet Cash, Cash Equivalents & ST Investments Accounts Receivable Other Receivables Total Receivables Inventory Other Current Assets Total Current Assets Property. Plant & Equipment Long-term investments and other LT Assets Goodwill & other intangibles Total Assets Accounts Payable Accrued Expenses Unearned Revenue Other Current Liabilities 97% 20% 10% 2.9% 3.4% 2.750 18.7% 703% 100% 240% 2079 0.0% 20.7% 155% 285 62.9% 6.45 04 5.7 01 130% 20% 00% 26% 17% 18% 19.25 70:25 519 40% TON ON 7.296 00% 27 13 99 25 33 139 11 13.9% 0.0% 13.9% 16.1% 10% 32.8% 10.8% 169 54 75 100.0% 93 0.9 004 18 0 0.0% 72.8% 72.4% 0.0% 0.6% 91.1% 249 449 221 100.0% 81 31 0 0 685 35 20 79 100.0% 0.99 100.0% 100.0 15% 86 100.0% 163 07 415 18 1000% 3 55% 100.0% 53 715 1389 240 1000 101 7 111 21 131 ON 1484 80" 00 00 209 004 50% 46 Notepad & Calculator High usiness ublishing kati Financial Analysis Simulation: Data Detective AN EP S # Filter Builder | OP A SELECTV F SELECT Call Highlighter H COROWTuner images Total Assets Accounts Payable Accrued Exponses Unearned Revenue Other Current Liabilities Total Current Liabilities Long-Term Debt Capital Leases Other Non-Current Liabilities Total Liabilities Common Stock Additional Paid in Capital Hotained Earnings Treasury Stock Comprehensive Income and Other Total Equity Total Liabilities and Equity 100.0% 9.3% 6.9% 00% 16.0% 32.2% 23.3% 0.0% 48% 60.4% 0.0% 33.7% 45 8% -39 79 SELECTV 3.1 100.0% 14.6% 80% 0.0% 00% 22.6% 00% 00% 4.1% 26.8% 11% 9.0% 67.7 32 0.3% 73.2% 100.0% 100.0% 23% 26% 00% 5.0% 9.9% 40.6% 0.1% 17 0% 67.6% 24.7% 0.0% 93% 0.0% SELECI V Hospitality Beverages 2.29 04% 55 100.0% 100.0% 100.0% 8.1% 16.3% 53% 3.1% 97% 719 0.0% 41% 138% 48% 83% 14% 16.0% 36.4% 27.5% 30.8% 52.4% 13.3% 0.0% 21% 0.09 43.2% 5.9% 177% 89.9% 96.7% $8.5% 0.1% 0.24 3.29 6.7% 22.99 58% 469 80.7% 58:25 0.0 -10829 257 -13% 13 00 10.1% 3.3% 41.5% 100.0% 100.0% 100.0% H SELECT Retail, Hes 16 100.0% 100.0% 16 89 20% 78% 131% 11% 0096 28% 0.49 28.6% 15.4% 0.0% 458% 00% 0.0% 3.4 202 32.0% 85.6% 00 O ON 275 7209 46.1 0.0% 52 0391 52 68.0% 14.5% 100.0% 100.0% SELECTV Financial BEN 100.0% 100.0 3.15 12% 53% 0:09 3.59 11 0 76 23.15 18.15 2519 25 % 0.15 00 122 9.49 50.6% 48.7% 0.0% 3515 10.95 2729 00% 009 -10 12096 602 05 -16% 02% 39.6% 100.0% 32.4% 100.0% 51,395 100.0% 100.0% Notepad a Calculator Danh PU ng Financial Analysis Simulation: Data Detective Builder OFF B F G H A SELECT 100.0% SELECTV 100.0% SELECTV 100.0% E SELECT Hospitality 100.0% 100.0% Beverages 100.0% SELECT V Retail, Hes 100.0% 100.0% SELECT V Finance 100.0% 100 100 0% 00% 100.0% 58.8% 19.2% 0.0% 139 1000% 67.7% 8.4% 0.6% 0.0% 98% 49.3% 0.0% 100.0% 66.0% 177% 00% 1.8% 00% 100.0% 65.7% 119 0.0% 589 100.0% 4725 279% 12.8% 29% 100.0% 37.1% 12.05 0.0% 100 169 1000% 33.8% 5035 00% 00% 00 8 KOON 100.0% 83 296 100% 0.0% 1.496 0.0% 0.5% 0.4% 0.9% 0.0% 3.8% 0 0% -23 9% 112% -10% Highlighter Total Liabilities and Equity Income Statement Revenue Cost of Goods Sold Selling. General & Admin Exp. R&D Exp. Depreciation & Amort. Other Operating Expenses/income Interest Expense Other Expenses & Revenues Income Tax Expense Other Net Income Ratios ROF Pront Margin Asset Turnover 1.1" 0.0% 0.4% 5.79 0.0% 15.4% -54% 59% 20% 0:39 0.2 4.1% 1896 13.15 0.0% 7.6% -10% 00 50% 00 013 0.89 11 00 165 00% 029 29 0.79 57 11.7% 07 9.6% 015 38.34 86% 3100% 11 10 17 80% 30% 1 x 55 90% 15.4 2x 1190 575 14.10% 70% 024 0.10% 0.29 0.3% 208 30% 30 23 37.00% 10.5 OK DI otepad & Calculator M aillder I OFF A m G ghlighter H SELECT V SELECT V Uue Beverages VU 36% UU 15.4% SELECT -0.37 -0.2% SELECT Hospitality VU 76% 8.6% SELECT V Retail, Hei - 575 353 SELECT Financial UUT 0 1239 16.5% 298 30% 8.6% 100 3700% 16.5% 0.OK 8 90% 11.10% 615 1239 2 3% 3.50 Net Income Ratios 8 ROE Profit Margin Asset Turnover ROA LT Asset Turnover Inventory Turnover Days Inventory held HAR Turnover Days Sales Outstanding AP Turnover Days Payables Outstanding Working Capital Turnover Loverage ratio Current Ratio Quick Ratio 36.7% 17 80% 3.6% 1 9x 6,60% 18. 1x 10.4x 35.1 14.6% 25 18 0x 19.6 0.63% 1.5% 1x 0.5x 55 90% 15.4% 26x 34 60% 13 4x 10.4% 352 13x 279 10.7% 341 1 TOX 0.4% 3. 4x 25x 99 0.10% -0.2% 0.3% 2 90% 0.5x 6.9x 529 17.7% 206 10. 2x 359 0.00% 2.1% 10x 13 14 10% 76% 02x 1 60% Ox Ox 0 0 0.04 0 000x 3.5X 1 BX 1 BX 11 90% 579 1:50 760% 24.53 5.6 654 824 444 50x 67 31 90% 353 024 4209 to OX 0 3 44 21.00% 4 BX 5.3% 692 63.0 5.7 0.4% 388 0.13 2004 400% 12 25656 14 . 162 2011 32% 16. 210 10 020 11 2x 320 017 1 x 0.1% DO 0202 10 TI 2.24 100 0 OT 03 pad & Calculator 753


