Answered step by step
Verified Expert Solution
Question
1 Approved Answer
WRITE A WRITTEN SUMMARY ON THE IMAGES BELOW Nike, Inc.: Cost of Capital On July 5, 2001, Kimi Ford, a portfolio manager at NorthPoint Group,
WRITE A WRITTEN SUMMARY ON THE IMAGES BELOW 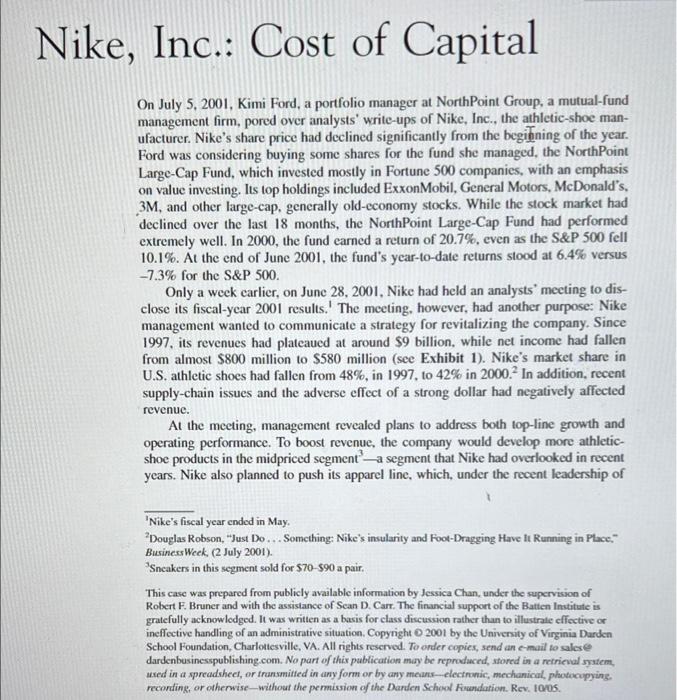
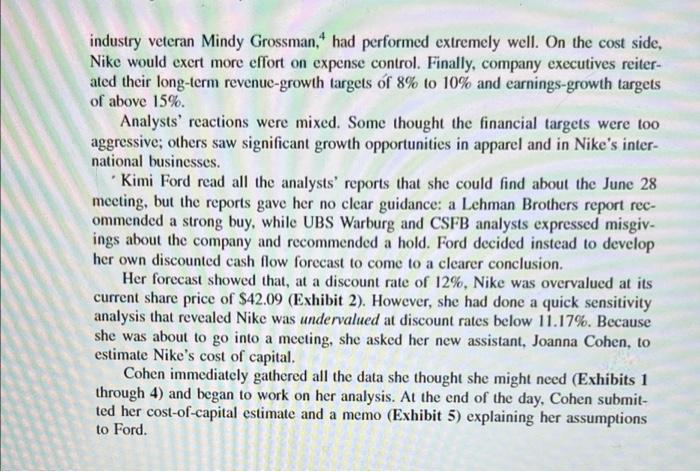
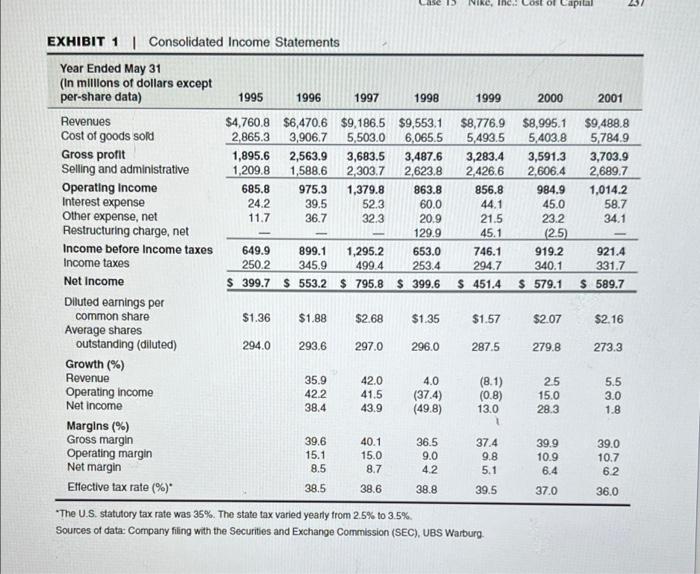
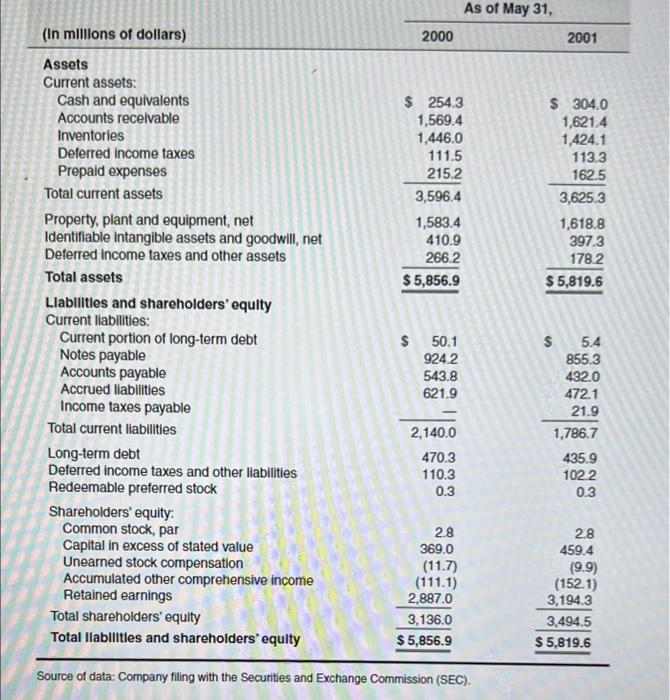
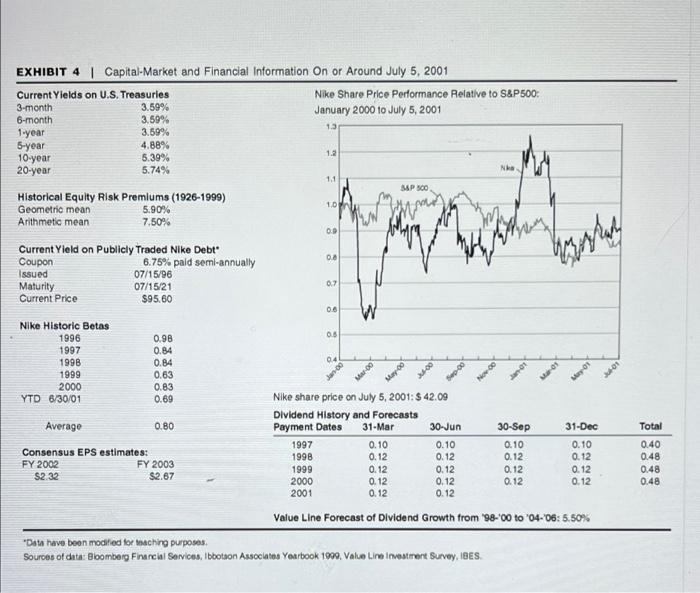
Nike, Inc.: Cost of Capital On July 5, 2001, Kimi Ford, a portfolio manager at NorthPoint Group, a mutual-fund management firm, pored over analysts' write-ups of Nike, Inc., the athletic shoe man- ufacturer. Nike's share price had declined significantly from the beginning of the year. Ford was considering buying some shares for the fund she managed, the NorthPoint Large-Cap Fund, which invested mostly in Fortune 500 companies, with an emphasis on value investing. Its top holdings included ExxonMobil, General Motors, McDonald's, 3M, and other large-cap, generally old-economy stocks. While the stock market had declined over the last 18 months, the NorthPoint Large-Cap Fund had performed extremely well. In 2000, the fund earned a return of 20.7%, even as the S&P 500 fell 10.1%. At the end of June 2001, the fund's year-to-date returns stood at 6.4% versus -7.3% for the S&P 500. Only a week carlier, on June 28, 2001, Nike had held an analysts' meeting to dis- close its fiscal-year 2001 results. The meeting, however, had another purpose: Nike management wanted to communicate a strategy for revitalizing the company. Since 1997, ils revenues had plateaued at around $9 billion, while net income had fallen from almost $800 million to S580 million (see Exhibit 1). Nike's market share in U.S. athletic shoes had fallen from 48%, in 1997, to 42% in 2000. In addition, recent supply-chain issues and the adverse effect of a strong dollar had negatively affected revenue. At the meeting, management revealed plans to address both top-line growth and operating performance. To boost revenue, the company would develop more athletic- shoe products in the midpriced segment'-a segment that Nike had overlooked in recent years. Nike also planned to push its apparel line, which, under the recent leadership of 'Nike's fiscal year ended in May. Douglas Robson, "Just Do .. Something: Nike's insularity and Foot-Dragging Have It Running in Place." Business Week. (2 July 2001). Sneakers in this segment sold for 570-590 a pair. This case was prepared from publicly available information by Jessica Chan, under the supervision of Robert F. Bruner and with the assistance of Sean D. Carr. The financial support of the Batten Institute is gratefully acknowledged. It was written as a basis for class discussion rather than to illustrate effective or ineffective handling of an administrative situation. Copyright 2001 by the University of Virginia Darden School Foundation, Charlottesville, VA. All rights reserved. To order copies, send an e-mail to salese dardenbusinesspublishing.com. No part of this publication may be reproduced, stored in a retrieval system, used in a spreadsheet, or transmitted in any form or by any means--electronic, mechanical, photocopying recording, or otherwise-without the permission of the Darden School Fundation. Rev. tous. industry veteran Mindy Grossman," had performed extremely well. On the cost side, Nike would exert more effort on expense control. Finally, company executives reiter- ated their long-term revenue-growth targets of 8% to 10% and earnings-growth targets of above 15%. Analysts' reactions were mixed. Some thought the financial targets were too aggressive; others saw significant growth opportunities in apparel and in Nike's inter- national businesses. Kimi Ford read all the analysts' reports that she could find about the June 28 meeting, but the reports gave her no clear guidance: a Lehman Brothers report rec- ommended a strong buy, while UBS Warburg and CSFB analysts expressed misgiv- ings about the company and recommended a hold. Ford decided instead to develop her own discounted cash flow forecast to come to a clearer conclusion. Her forecast showed that, at a discount rate of 12%, Nike was overvalued at its current share price of $42.09 (Exhibit 2). However, she had done a quick sensitivity analysis that revealed Nike was undervalued at discount rates below 11.17%. Because she was about to go into a meeting, she asked her new assistant, Joanna Cohen, to estimate Nike's cost of capital. Cohen immediately gathered all the data she thought she might need (Exhibits 1 through 4) and began to work on her analysis. At the end of the day, Cohen submit- ted her cost-of-capital estimate and a memo (Exhibit 5) explaining her assumptions to Ford. 13 of Capital 13) 1999 2000 2001 EXHIBIT 1 Consolidated Income Statements Year Ended May 31 (In millions of dollars except per-share data) 1995 1996 1997 1998 Revenues $4,760.8 $6,470.6 $9,186,5 $9,553.1 Cost of goods sold 2,865.3 3,906.7 5,503.0 6,065.5 Gross profit 1,895.6 2,563.9 3,683.5 3,487.6 Selling and administrative 1,209.8 1,588.6 2,303.7 2,623.8 Operating Income 685.8 975.3 1,379.8 863.8 Interest expense 24.2 39.5 52.3 60.0 Other expense, net 11.7 36.7 32.3 20.9 Restructuring charge, net 129.9 Income before Income taxes 649.9 899.1 1,295.2 653.0 Income taxes 250.2 345.9 4994 253.4 Net Income $ 399.7 $ 553.2 $ 795.8 $ 399.6 Diluted earnings per common share $1.36 $1.88 $2.68 $1.35 Average shares outstanding (diluted) 294.0 293.6 297.0 296.0 Growth (%) Revenue 35.9 42.0 4.0 Operating income 41.5 (37.4) Net income 38.4 43.9 (49.8) Margins (%) Gross margin 39.6 40.1 36.5 Operating margin 15.1 15.0 9.0 Net margin 8.7 4.2 Effective tax rate (%) 38.5 38.6 38.8 $8,776.9 $8.995.1 5,493.5 5,403.8 3,283.4 3,591.3 2.426.6 2,606.4 856.8 984.9 44.1 45.0 21.5 23.2 45.1 (2.5) 746.1 919.2 294.7 340.1 $ 451.4 $ 579.1 $9.488.8 5784.9 3,703.9 2.689.7 1,014.2 58.7 34.1 921.4 331.7 $ 589.7 $1.57 $2.07 $2.16 287.5 279.8 273.3 42.2 (8.1) (0.8) 13.0 25 15.0 28.3 5.5 3.0 1.8 37.4 9.8 5.1 39.9 10.9 6.4 39.0 10.7 62 8.5 39.5 37.0 36.0 "The U.S. statutory tax rate was 35%. The state tax varied yearly from 2.5% to 3.5% Sources of data: Company filing with the Securities and Exchange Commission (SEC), UBS Warburg. EXHIBIT 2 Discounted Cash Flow Analysis 2002 2003 2004 2005 2006 2007 2008 2009 2010 2011 : 8 25.0 12.00 3.00 Assumptions: Revenue growth (%) 7.0 6.5 6.5 6.5 6.0 60 6.0 60 6.0 6.0 COGS/sales (%) 600 60.0 59.5 59.5 59.0 59.0 58.5 58.5 58.0 58.0 SG&A/sales (%) 28.0 27.5 27.0 26.5 260 25.5 25.0 25.0 25.0 Tax rate (%) 38.0 38.0 380 380 380 380 380 38,0 380 38.0 Current assets/sales (%) 38.0 380 38.0 380 38.0 380 380 380 38.0 38.0 Current liabilities/sales (%) 11.5 11.5 11.5 11.5 11.5 11.5 11.5 11.5 11.5 11.5 Yearly depreciation and capex equal each other Cost of capital (%) Terminal value growth rate (%) Discounted Cash Flow (in milions of dollars except per-share data) Operating income $ 1,218.4 $1,351.6 $1,554 6 $1,717,0 $1,950,0 $2,1359 $2.410.2 $2,554.8 $2,790.1 $2.9575 Taxes 463.0 513,6 590.8 6525 741.0 811.7 915.9 970.8 1.0602 1.123.9 NOPAT 755.4 838.0 9639 1,0645 1,209,0 1,3243 1.4943 1,584,0 1,729.9 1,833.7 Capex, net of depreciation Change in NWC 8.8 (174.9) (1863) (1984) (195.0) (206.7) (219.1) (2323) (2462) (261.0) Free cash flow 7641 663.1 777.6 8662 1.014.0 1.1176 1275.2 1,351,7 1,483.7 1,572.7 Terminal value 17,998.3 Total flows 7641 663.1 7776 8662 1,014,0 1,1176 12752 1,351.7 1.483.7 19,571,0 Present value of flows $ 682.3 $ 528.6 $ 553.5 $ 550,5 $ 575.4 $ 5662 $ 576.8 $ 545.9 $ 536.0 $6,3012 Enterprise value $11,415.4 Less: current outstanding debt $ 1.296.6 Equity value $10,118.8 Current shares outstanding 271.5 Equity value per share $ 37.27 Current share price: $ 12.09 Sensitivity of equity value to discount rate: Discount rate Equity value 8.00% $ 75.80 8.50% 67 85 9.00% 61.25 9.50% 55.68 10.00% 50.92 10.50% 46.81 11.00% 43.22 11.17% 42.09 11.50% 40.07 12.00% 37 27 As of May 31, 2000 2001 $ 254.3 1,569.4 1,446.0 111.5 215.2 3,596.4 1,583.4 410.9 266.2 $ 5,856.9 $ 304.0 1,621.4 1,424.1 113.3 162.5 3,625.3 1,618.8 397.3 178.2 $ 5,819.6 (In millions of dollars) Assets Current assets: Cash and equivalents Accounts receivable Inventories Deferred income taxes Prepaid expenses Total current assets Property, plant and equipment, net Identifiable intangible assets and goodwill , net Deferred income taxes and other assets Total assets Liabilities and shareholders' equity Current liabilities: Current portion of long-term debt Notes payable Accounts payable Accrued liabilities Income taxes payable Total current liabilities Long-term debt Deferred income taxes and other liabilities Redeemable preferred stock Shareholders' equity: Common stock, par Capital in excess of stated value Unearned stock compensation Accumulated other comprehensive income Retained earnings Total shareholders' equity Total llabilities and shareholders' equity $ 50.1 924.2 543.8 621.9 $ 5.4 855.3 432.0 472.1 21.9 1,786.7 2,140.0 470.3 110.3 0.3 435.9 1022 0.3 2.8 369.0 (11.7) (111.1) 2,887.0 3,136.0 $ 5,856.9 2.8 459.4 (9.9) (152.1) 3,194.3 3,494.5 $ 5,819.6 Source of data: Company filing with the Securities and Exchange Commission (SEC). EXHIBIT 4 | Capital Market and Financial Information On or Around July 5, 2001 Current Yields on U.S. Treasurles Nike Share Price Performance Relative to S&P500 3-month 3.59% January 2000 to July 5, 2001 6-month 3.59% 1.3 1-year 3.59% 5-year 4.88% 10-year 5.39% 20-year 5.74% Na S&P 500 Historical Equity Risk Premiums (1926-1999) Geometric mean 5.90% Arithmetic mean 7.50% 1.2 1.1 10 00 pour rah 00 Current Yield on Publicly Traded Nike Debt Coupon 6.75% pald semi-annually Issued 07/15/96 Maturity 07/15/21 Current Price $95.60 0.7 0.6 05 Nike Historic Betas 1996 1997 1998 1999 2000 YTD 6/30/01 04 0.98 0.84 0.84 0.63 0.83 0.69 Mar-00 200 Sep-00 Now . Mares Mayon Jan-00 May 00 Average 0.80 Total Nike share price on July 5, 2001:$ 42.09 Dividend History and Forecasts Payment Dates 31-Mar 30-Jun 1997 0.10 0.10 1998 0.12 0.12 1999 0.12 0.12 2000 0.12 0.12 2001 0.12 0.12 Consensus EPS estimates: FY 2002 FY 2003 $2.32 $2.67 30-Sep 0.10 0.12 0.12 0.12 31-Dec 0.10 0.12 0.12 0.12 0.40 0.48 0.48 0.48 Value Line Forecast of Dividend Growth from '98-'00 to '04-'06:5.50% "Dat have been modified for teaching purposes Sources of data: Blomberg Financial Services, Ibbotson Associates Yearbook 1999, Value Line Investment Survey, IBES 


Step by Step Solution
There are 3 Steps involved in it
Step: 1

Get Instant Access to Expert-Tailored Solutions
See step-by-step solutions with expert insights and AI powered tools for academic success
Step: 2

Step: 3

Ace Your Homework with AI
Get the answers you need in no time with our AI-driven, step-by-step assistance
Get Started


