

Question: write an executive summary for this case. 1.Why is costing relevant to a police force and what leads this controversy ? 2. Who are the
write an executive summary for this case. 1.Why is costing relevant to a police force and what leads this controversy ? 2. Who are the stakeholders ? 3. What real life communities use OPP as their police force who used to have their own police system ( google this ) ? 4. Why is the auditor general concerned about the previous billing model ? Why do you think it is inadequate ? 5. Calculate the cost in 2015 for service in each municipality using the new billing model . What is the impact of using two cost drivers on service cost for each municipality ? 6. Consider the impact of allocating costs based on just one driver . Calculate the cost in 2015 for each municipality considering properties , CFS , population , household income and property value . 7. After evaluating service costs under different drivers , which seems most equitable . Recommend one . Is the new billing model more fair . If so , defend your answer . If not , propose a new one.
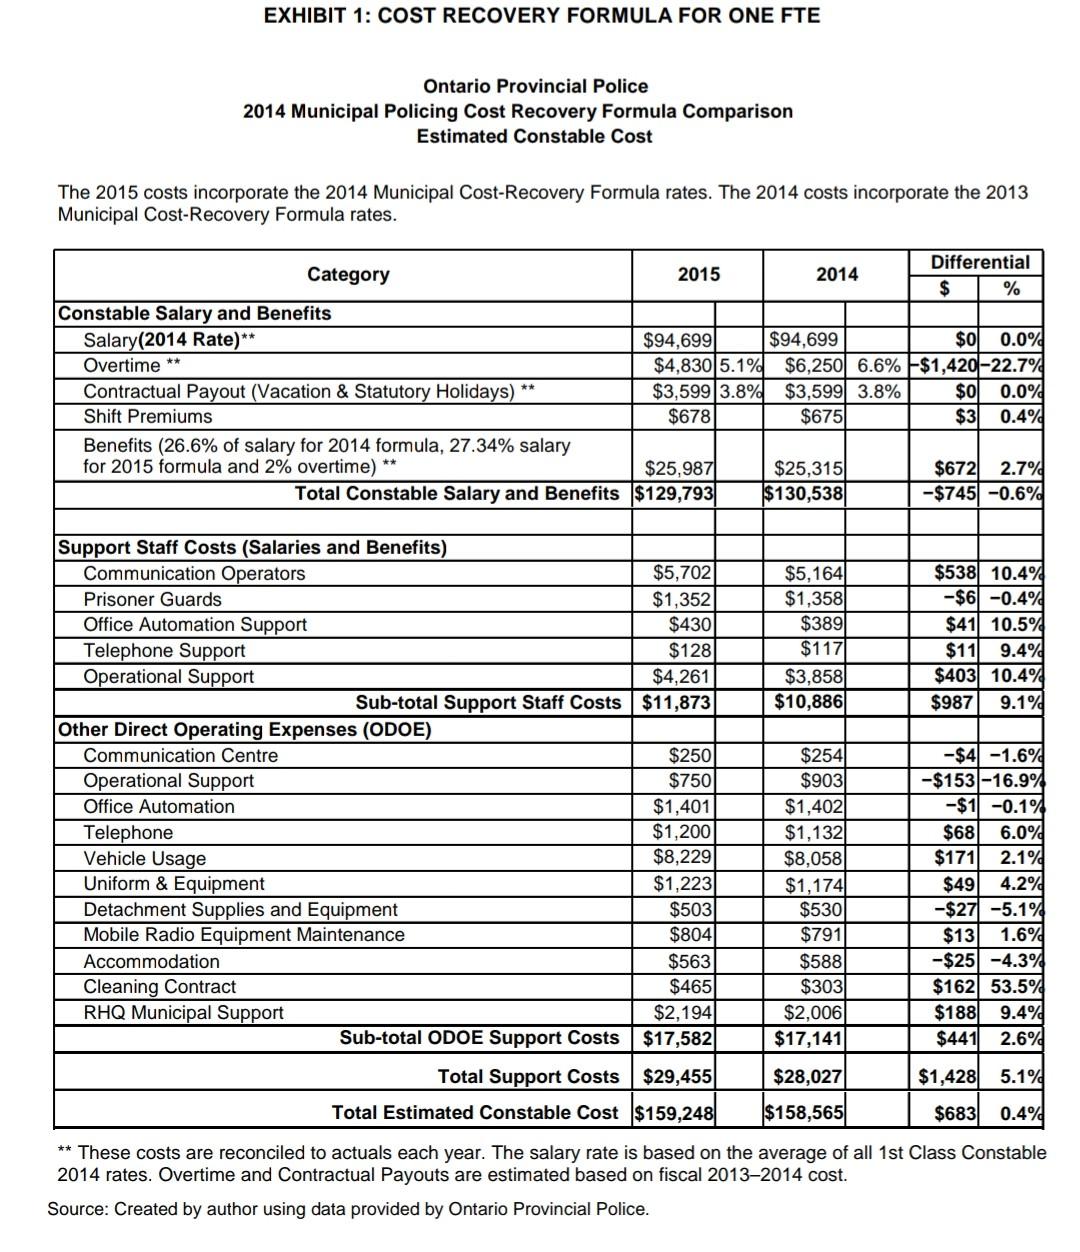
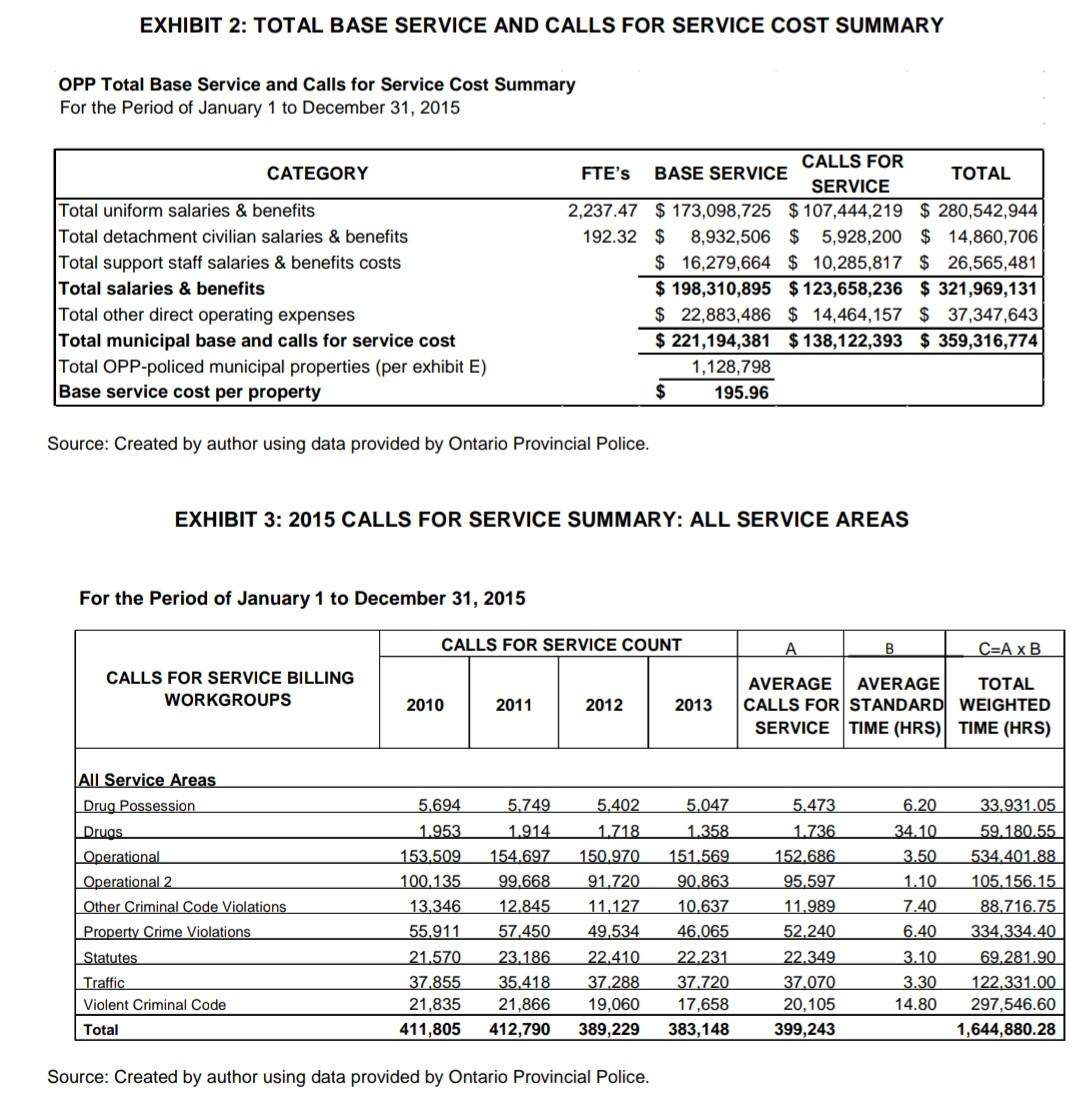
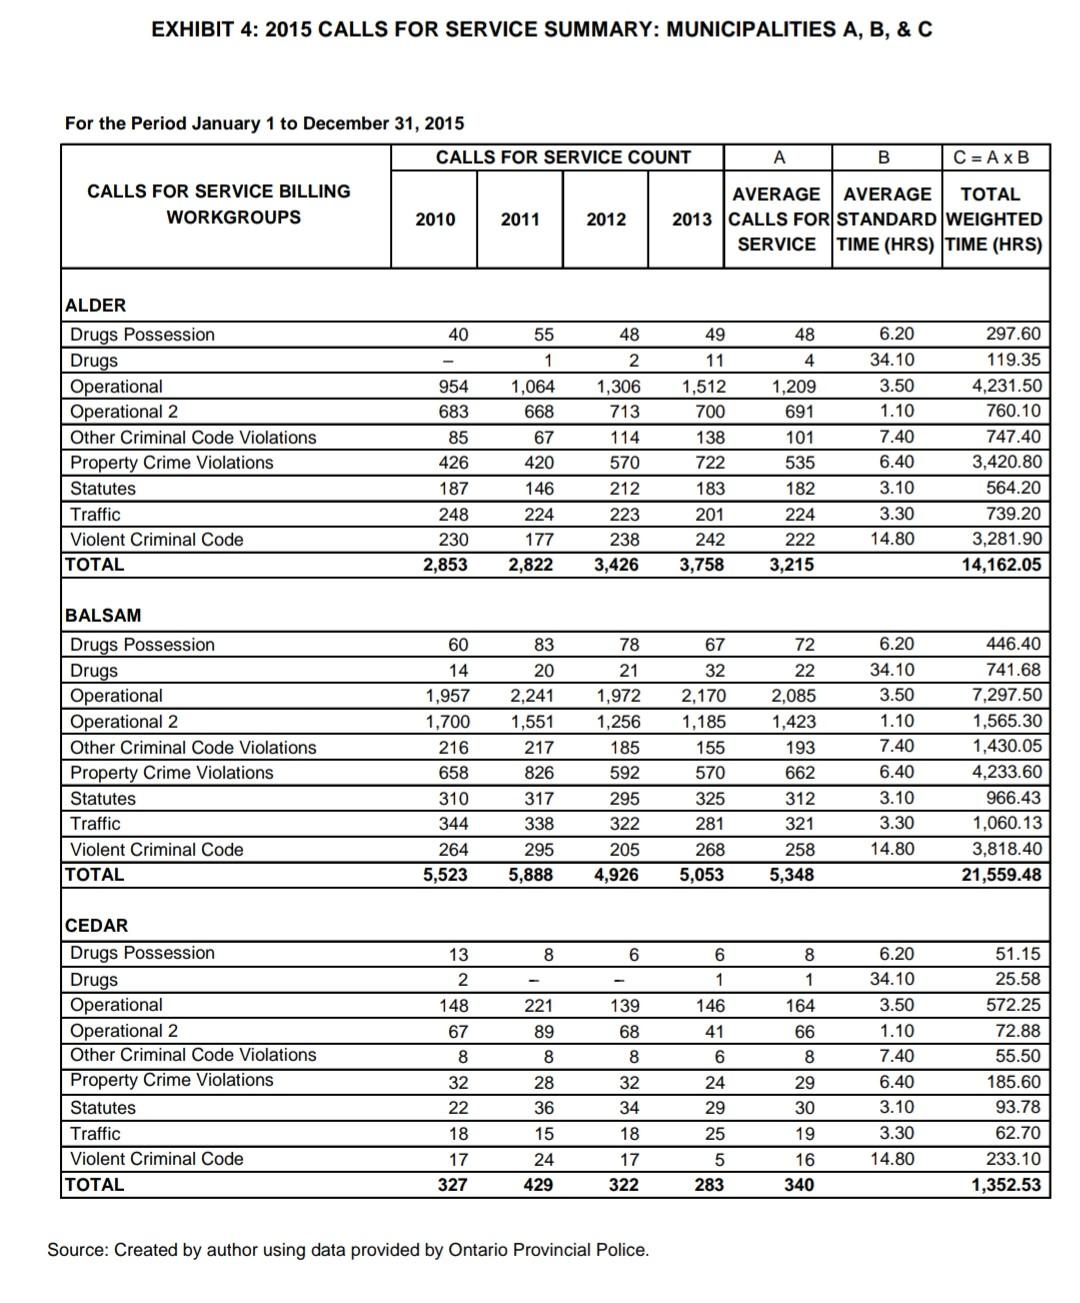
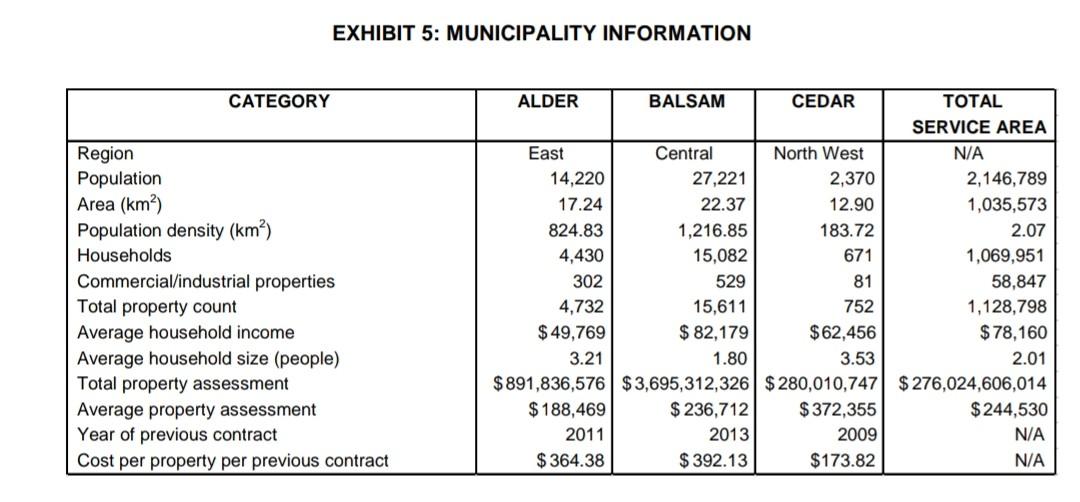
On January 17, 2015, the Ontario Provincial Police (OPP) released service cost estimates to all municipalities under its new municipal billing model. Donna Doran, commander of corporate services for the OPP, had personally overseen the development of the new model and was proud of the work her department had done. The new billing model, according to the recommendations of the auditor general, was designed to provide a more consistent, transparent, and accurate reflection of municipal servicing costs. Doran scheduled a meeting with mayors from several municipalities to receive feedback on the new model. While she was not expecting unanimous approval, she was optimistic about how it would be received. What she discovered, however, was that the mayors were not entirely sold on the new model. In fact, they all had their own opinions on how each municipality should be billed. Mayor Allen Auburn of Alder was not satisfied with the new billing model. Alder had fallen on hard times due to the slow economy, and the blame was placed squarely at Auburn's feet. He argued that the new billing model put an unfair burden on Alder's crime rate, which was an effect of the high rate of unemployment. Auburn proposed that police costs be allocated based on a municipality's ability to pay, as indicated by metrics such as household income and property values. Mayor Bethany Brown of Balsam also took issue with the new model, though for different reasons. Balsam was a community on the rise, with a rapidly declining crime rate. Therefore, she believed it was both prejudicial and antiquated to bill municipalities based on historical crime rates because that model did not reflect current events. Brown demanded that police costs be allocated per capita because this was the most objective and current metric available. Mayor Charles Carlyle of Cedar echoed the concerns of his colleagues. Known as a summer hotspot, Cedar was among the most affluent municipalities serviced by the OPP. Carlyle echoed the sentiments of his voters in his belief that preventing crime was solely the responsibility of the OPP. He maintained that municipalities should not be penalized in the event that the crime rate should rise and that police costs should be allocated exclusively on a per property basis. The mayors sitting before Doran were influential in their respective regions of the province. On the question of whether to accept the new billing model, other mayors were likely to follow their leads. Doran understood how important it was to demonstrate the merit of the new billing model in order to ensure its adoption. She did not want to waste the countless hours her department had spent revising the billing model. The auditor general was expecting a fairer, more consistent billing model, and Doran believed her team had delivered. ONTARIO PROVINCIAL POLICE The OPP was among the largest police forces in North America, with more than 6,000 police officers. As of 2014, the OPP provided services to 324 municipalities (150 contracts, 174 non-contracts) and operated 77 detachments with an additional 88 satellite stations. Detachments reported to one of five regional headquarters or the Highway Safety Division, which reported to General Headquarters. Under the Police Services Act of 1990, the OPP had the following responsibilities: . Provide police services to parts of Ontario that did not have municipal police forces Patrol provincial highways, waterways, and trail systems Provide police services under contract where requested by municipalities Provide emergency and other support services Investigate complex criminal cases and organized crime . Under this act, it was the responsibility of municipalities to provide adequate and effective police services in accordance with their needs. Municipalities had the following methods to satisfy this obligation: Establish a police service alone or with another municipality Enter into an agreement with the council of another municipality to have its police services provided by the other municipality as long as the municipality was contiguous to it Enter into an agreement to have police services provided by the OPP If, however, a municipality did not provide police services by any of these means, the OPP provided police services to the municipality on a non-contract basis. PREVIOUS BILLING MODEL Contract Municipalities Under the previous model, municipal contracts were established based on the number of officers (FTES) required to meet service level requirements and took into account supervisory, support, and administrative costs. Municipalities were billed based on actual salary and benefit costs of staff and FTEs in their contract. In addition to the salaries and benefits for contract staff providing policing to the municipality, the OPP used the municipal cost recovery formula to recover the cost of select support salary and benefit expenditures, support services, and other direct operating expenses (ODOE) such as vehicles, uniforms, and equipment (see Exhibit 1). Non-Contract Municipalities Non-contract municipalities were charged for policing services based on their portion of detachment workload, which was re-calculated each year using data from the previous four years. The actual salaries and benefits were applied to the calculated FTEs, and the municipal cost recovery formula was used to recover the cost of select support salary and benefit expenditures, support services, and ODOE. AUDITOR GENERAL'S RECOMMENDATIONS The previous billing model for contract and non-contract municipalities had been in place for 15 years and was due for an update. The main criticisms of the previous billing model were that it generated wide variations in per household/property policing costs;' and was overly complex, difficult to administer, and challenging to communicate to municipalities. . The 2012 auditor general's report directed the OPP to review the billing process. Recommendation 7 states: To promote better relations with, and consistent services to municipalities, and fairer and more transparent billing processes, the OPP... should . seek ways to simplify, and make more transparent its cost recovery methods and consider whether various grants and credits should be amalgamated into one all-encompassing costing formula; address the issues in its costing and billing methods that result in municipalities paying different rates and consider phasing in cost increases over time rather than when contracts are renewed; and consider establishing a policy that would require that all costs for providing services to support municipal police forces be identified as well as the proportion to be recovered.? In 2012, all municipalities without contracts were billed using the latest version of the cost recovery formula. Prior to 2012, municipalities under contract, all with five-year terms, were billed based on versions from as far back as 2003. As a result, municipalities could experience increases as much as 60 per cent in their support and ODOE costs in the year of renewal. Moreover, had the government set terms where municipalities under contract were billed using the most up-to-date cost recovery formula, it would have realized millions in additional cost recoveries from municipalities. In order to prevent municipalities being exposed to significant variances in policing costs, the auditor general recommended that the OPP provide a more transparent cost recovery method that addressed municipalities paying different rates and, instead, billed municipalities based on current rather than historical costs. On average, the OPP compared very favourably to municipal police service costs (OPP cost: $341/household in 2013). 2 2012 Annual Report, Office of the Auditor General of Ontario, Toronto, Ontario, p. 250. 3 Ibid, p. 249. NEW BILLING MODEL To address the recommendations outlined by the auditor general of Ontario, the OPP set about improving its municipal billing process. In December 2013, the OPP announced that, in accordance with the early termination clause in its agreements, all municipal contracts would be terminated as of December 31, 2014. Beginning 2015, all municipalities would be billed under the new billing model. The new OPP billing model divided the majority of police service costs into two broad categories: base policing services and calls for service (CFS). In 2015, these two categories made up approximately 56 per cent and 35 per cent of annual police costs, respectively. The remaining 9 per cent made up less costly items such as prisoner transport, accommodation, and cleaning services. Base Policing Services All municipalities required a base level of infrastructure, supervision, administration, and sufficient front- line policing necessary to respond to emergency CFS, provide proactive policing, and ensure the general safety and security of municipalities. Some examples of base policing services were legislated activities, proactive policing, training, and administrative duties. Under the new model, all municipalities paid an equal per property share of base service costs. Accordingly, the total cost of all FTEs providing base services was divided by the total number of properties serviced by the OPP, then prorated by the number of properties in each municipality to determine the base service cost recovery (see Exhibit 2). The property count included in the OPP municipal policing bills was comprised of households and commercial and industrial properties. The property counts were updated annually based on municipal property assessment corporation data (see Exhibit 3). Calls for Service CFS typically related to any request that had to responded to by a police office Examples were criminal code violations or motor vehicle accidents. CFS could have significant year-to-year variations in some municipalities. Therefore, the OPP elected to calculate CFS costs using four-year averages. In doing so, this minimized the impact of year-to-year changes. An average time standard was calculated for every CFS category based on the four-year average time to respond to each category of CFS. For each municipality, CFS by category was also calculated using a four-year average. The average CFS was then multiplied by the average time standard for each CFS category to calculate the total weighted time applicable to each municipality (see Exhibit 4). The total weighted time for each municipality was then divided by the total weighted time for all service areas (see Exhibit 3) to calculate the municipality's proportionate share of CFS costs. Other Costs In addition to base policing services and CFS, overtime, court security, prisoner transport, accommodations, and cleaning, if applicable, were calculated for each individual municipality based on usage. EXHIBIT 1: COST RECOVERY FORMULA FOR ONE FTE Ontario Provincial Police 2014 Municipal Policing Cost Recovery Formula Comparison Estimated Constable Cost The 2015 costs incorporate the 2014 Municipal Cost-Recovery Formula rates. The 2014 costs incorporate the 2013 Municipal Cost-Recovery Formula rates. Differential Category 2015 2014 $ % Constable Salary and Benefits Salary(2014 Rate)** $94,6991 $94,699 $0 0.0% Overtime ** $4,830 5.1% $6,250 6.6% $1,420-22.7% Contractual Payout (Vacation & Statutory Holidays) $3,599 3.8% $3,599 3.8% $0 0.0% Shift Premiums $678 $675 $3 0.4% Benefits (26.6% of salary for 2014 formula, 27.34% salary for 2015 formula and 2% overtime) $25,987 $25,3151 $672 2.7% Total Constable Salary and Benefits $129,793 $130,538 -$745 -0.6% $5,164 $1,358 $389 $117 $3,858 $10,886 $538 10.4% -$6 -0.4% $41 10.5% $11 9.4% $403 10.4% $987 9.1% Support Staff Costs (Salaries and Benefits) Communication Operators $5,702 Prisoner Guards $1,352 Office Automation Support $430 Telephone Support $128 Operational Support $4,261 Sub-total Support Staff Costs $11,873 Other Direct Operating Expenses (ODOE) Communication Centre $250 Operational Support $750 Office Automation $1,401 Telephone $1,200 Vehicle Usage $8,229 Uniform & Equipment $1,223 Detachment Supplies and Equipment $503 Mobile Radio Equipment Maintenance $804 Accommodation $563 Cleaning Contract $465 RHQ Municipal Support $2,194 Sub-total ODOE Support Costs $17,582 $254 $903 $1,402 $1,132 $8,058 $1,174 $530 $791 $588 $303 $2,006 $17,141 -$4 -1.6% -$153-16.9% -$1 -0.14 $68 6.0% $171 2.1% $49 4.2% -$27 -5.14 $13 1.6% -$25 -4.3% $162 53.5% $188) 9.4% $441 2.6% $28,027 $1,428 5.1% Total Support Costs $29,455 Total Estimated Constable Cost $159,248 $158,565 $683 0.4% ** These costs are reconciled to actuals each year. The salary rate is based on the average of all 1st Class Constable 2014 rates. Overtime and Contractual Payouts are estimated based on fiscal 2013-2014 cost. Source: Created by author using data provided by Ontario Provincial Police. EXHIBIT 2: TOTAL BASE SERVICE AND CALLS FOR SERVICE COST SUMMARY OPP Total Base Service and Calls for Service Cost Summary For the Period of January 1 to December 31, 2015 CATEGORY Total uniform salaries & benefits Total detachment civilian salaries & benefits Total support staff salaries & benefits costs Total salaries & benefits Total other direct operating expenses Total municipal base and calls for service cost Total OPP-policed municipal properties (per exhibit E) Base service cost per property CALLS FOR FTE's BASE SERVICE TOTAL SERVICE 2,237.47 $ 173,098,725 $ 107,444,219 $ 280,542,944 192.32 $ 8,932,506 $ 5,928,200 $ 14,860,706 $ 16,279,664 $ 10,285,817 $ 26,565,481 $ 198,310,895 $ 123,658,236 $ 321,969,131 $ 22,883,486 $ 14,464,157 $ 37,347,643 $ 221,194,381 $ 138,122,393 $ 359,316,774 1,128,798 $ 195.96 Source: Created by author using data provided by Ontario Provincial Police. EXHIBIT 3: 2015 CALLS FOR SERVICE SUMMARY: ALL SERVICE AREAS For the Period of January 1 to December 31, 2015 CALLS FOR SERVICE COUNT A B C=A B CALLS FOR SERVICE BILLING WORKGROUPS 2010 2011 2012 2013 AVERAGE AVERAGE TOTAL CALLS FOR STANDARD WEIGHTED SERVICE TIME (HRS) TIME (HRS) 5.402 All Service Areas Drug Possession Drugs Operational Operational 2 Other Criminal Code Violations Property Crime Violations 5.694 1.953 153.509 100.135 13.346 55.911 21.570 37.855 21,835 411,805 5.749 1.914 154.697 99.668 12.845 57.450 23.186 35.418 21,866 412,790 1.718 150.970 91.720 11.127 49.534 22.410 37.288 19,060 389,229 5.047 1.358 151.569 90.863 10.637 46.065 22.231 37.720 17,658 383,148 5.473 1.736 152.686 95.597 11.989 52.240 22.349 37.070 20,105 399,243 6.20 34.10 3.50 1.10 7.40 6.40 3.10 3.30 14.80 33.931.05 59.180.55 534.401.88 105.156.15 88.716.75 334,334.40 69.281.90 122.331.00 297,546.60 1,644,880.28 Statutes Traffic Violent Criminal Code Total Source: Created by author using data provided by Ontario Provincial Police. EXHIBIT 5: MUNICIPALITY INFORMATION CATEGORY ALDER BALSAM CEDAR TOTAL SERVICE AREA East Central North West N/A 14,220 27,221 2,370 2,146,789 17.24 22.37 12.90 1,035,573 824.83 1,216.85 183.72 2.07 4,430 15,082 671 1,069,951 529 81 58,847 4,732 15,611 752 1,128,798 $ 49,769 $ 82,179 $62,456 $78,160 3.21 1.80 3.53 2.01 $891,836,576 $3,695,312,326 $280,010,747 $ 276,024,606,014 $ 188,469 $ 236,712 $372,355 $244,530 2011 2013 2009 N/A $364.38 $ 392.13 $173.82 N/A Region Population Area (km) Population density (km) Households Commercial/industrial properties Total property count Average household income Average household size (people) Total property assessment Average property assessment Year of previous contract Cost per property per previous contract 302 On January 17, 2015, the Ontario Provincial Police (OPP) released service cost estimates to all municipalities under its new municipal billing model. Donna Doran, commander of corporate services for the OPP, had personally overseen the development of the new model and was proud of the work her department had done. The new billing model, according to the recommendations of the auditor general, was designed to provide a more consistent, transparent, and accurate reflection of municipal servicing costs. Doran scheduled a meeting with mayors from several municipalities to receive feedback on the new model. While she was not expecting unanimous approval, she was optimistic about how it would be received. What she discovered, however, was that the mayors were not entirely sold on the new model. In fact, they all had their own opinions on how each municipality should be billed. Mayor Allen Auburn of Alder was not satisfied with the new billing model. Alder had fallen on hard times due to the slow economy, and the blame was placed squarely at Auburn's feet. He argued that the new billing model put an unfair burden on Alder's crime rate, which was an effect of the high rate of unemployment. Auburn proposed that police costs be allocated based on a municipality's ability to pay, as indicated by metrics such as household income and property values. Mayor Bethany Brown of Balsam also took issue with the new model, though for different reasons. Balsam was a community on the rise, with a rapidly declining crime rate. Therefore, she believed it was both prejudicial and antiquated to bill municipalities based on historical crime rates because that model did not reflect current events. Brown demanded that police costs be allocated per capita because this was the most objective and current metric available. Mayor Charles Carlyle of Cedar echoed the concerns of his colleagues. Known as a summer hotspot, Cedar was among the most affluent municipalities serviced by the OPP. Carlyle echoed the sentiments of his voters in his belief that preventing crime was solely the responsibility of the OPP. He maintained that municipalities should not be penalized in the event that the crime rate should rise and that police costs should be allocated exclusively on a per property basis. The mayors sitting before Doran were influential in their respective regions of the province. On the question of whether to accept the new billing model, other mayors were likely to follow their leads. Doran understood how important it was to demonstrate the merit of the new billing model in order to ensure its adoption. She did not want to waste the countless hours her department had spent revising the billing model. The auditor general was expecting a fairer, more consistent billing model, and Doran believed her team had delivered. ONTARIO PROVINCIAL POLICE The OPP was among the largest police forces in North America, with more than 6,000 police officers. As of 2014, the OPP provided services to 324 municipalities (150 contracts, 174 non-contracts) and operated 77 detachments with an additional 88 satellite stations. Detachments reported to one of five regional headquarters or the Highway Safety Division, which reported to General Headquarters. Under the Police Services Act of 1990, the OPP had the following responsibilities: . Provide police services to parts of Ontario that did not have municipal police forces Patrol provincial highways, waterways, and trail systems Provide police services under contract where requested by municipalities Provide emergency and other support services Investigate complex criminal cases and organized crime . Under this act, it was the responsibility of municipalities to provide adequate and effective police services in accordance with their needs. Municipalities had the following methods to satisfy this obligation: Establish a police service alone or with another municipality Enter into an agreement with the council of another municipality to have its police services provided by the other municipality as long as the municipality was contiguous to it Enter into an agreement to have police services provided by the OPP If, however, a municipality did not provide police services by any of these means, the OPP provided police services to the municipality on a non-contract basis. PREVIOUS BILLING MODEL Contract Municipalities Under the previous model, municipal contracts were established based on the number of officers (FTES) required to meet service level requirements and took into account supervisory, support, and administrative costs. Municipalities were billed based on actual salary and benefit costs of staff and FTEs in their contract. In addition to the salaries and benefits for contract staff providing policing to the municipality, the OPP used the municipal cost recovery formula to recover the cost of select support salary and benefit expenditures, support services, and other direct operating expenses (ODOE) such as vehicles, uniforms, and equipment (see Exhibit 1). Non-Contract Municipalities Non-contract municipalities were charged for policing services based on their portion of detachment workload, which was re-calculated each year using data from the previous four years. The actual salaries and benefits were applied to the calculated FTEs, and the municipal cost recovery formula was used to recover the cost of select support salary and benefit expenditures, support services, and ODOE. AUDITOR GENERAL'S RECOMMENDATIONS The previous billing model for contract and non-contract municipalities had been in place for 15 years and was due for an update. The main criticisms of the previous billing model were that it generated wide variations in per household/property policing costs;' and was overly complex, difficult to administer, and challenging to communicate to municipalities. . The 2012 auditor general's report directed the OPP to review the billing process. Recommendation 7 states: To promote better relations with, and consistent services to municipalities, and fairer and more transparent billing processes, the OPP... should . seek ways to simplify, and make more transparent its cost recovery methods and consider whether various grants and credits should be amalgamated into one all-encompassing costing formula; address the issues in its costing and billing methods that result in municipalities paying different rates and consider phasing in cost increases over time rather than when contracts are renewed; and consider establishing a policy that would require that all costs for providing services to support municipal police forces be identified as well as the proportion to be recovered.? In 2012, all municipalities without contracts were billed using the latest version of the cost recovery formula. Prior to 2012, municipalities under contract, all with five-year terms, were billed based on versions from as far back as 2003. As a result, municipalities could experience increases as much as 60 per cent in their support and ODOE costs in the year of renewal. Moreover, had the government set terms where municipalities under contract were billed using the most up-to-date cost recovery formula, it would have realized millions in additional cost recoveries from municipalities. In order to prevent municipalities being exposed to significant variances in policing costs, the auditor general recommended that the OPP provide a more transparent cost recovery method that addressed municipalities paying different rates and, instead, billed municipalities based on current rather than historical costs. On average, the OPP compared very favourably to municipal police service costs (OPP cost: $341/household in 2013). 2 2012 Annual Report, Office of the Auditor General of Ontario, Toronto, Ontario, p. 250. 3 Ibid, p. 249. NEW BILLING MODEL To address the recommendations outlined by the auditor general of Ontario, the OPP set about improving its municipal billing process. In December 2013, the OPP announced that, in accordance with the early termination clause in its agreements, all municipal contracts would be terminated as of December 31, 2014. Beginning 2015, all municipalities would be billed under the new billing model. The new OPP billing model divided the majority of police service costs into two broad categories: base policing services and calls for service (CFS). In 2015, these two categories made up approximately 56 per cent and 35 per cent of annual police costs, respectively. The remaining 9 per cent made up less costly items such as prisoner transport, accommodation, and cleaning services. Base Policing Services All municipalities required a base level of infrastructure, supervision, administration, and sufficient front- line policing necessary to respond to emergency CFS, provide proactive policing, and ensure the general safety and security of municipalities. Some examples of base policing services were legislated activities, proactive policing, training, and administrative duties. Under the new model, all municipalities paid an equal per property share of base service costs. Accordingly, the total cost of all FTEs providing base services was divided by the total number of properties serviced by the OPP, then prorated by the number of properties in each municipality to determine the base service cost recovery (see Exhibit 2). The property count included in the OPP municipal policing bills was comprised of households and commercial and industrial properties. The property counts were updated annually based on municipal property assessment corporation data (see Exhibit 3). Calls for Service CFS typically related to any request that had to responded to by a police office Examples were criminal code violations or motor vehicle accidents. CFS could have significant year-to-year variations in some municipalities. Therefore, the OPP elected to calculate CFS costs using four-year averages. In doing so, this minimized the impact of year-to-year changes. An average time standard was calculated for every CFS category based on the four-year average time to respond to each category of CFS. For each municipality, CFS by category was also calculated using a four-year average. The average CFS was then multiplied by the average time standard for each CFS category to calculate the total weighted time applicable to each municipality (see Exhibit 4). The total weighted time for each municipality was then divided by the total weighted time for all service areas (see Exhibit 3) to calculate the municipality's proportionate share of CFS costs. Other Costs In addition to base policing services and CFS, overtime, court security, prisoner transport, accommodations, and cleaning, if applicable, were calculated for each individual municipality based on usage. EXHIBIT 1: COST RECOVERY FORMULA FOR ONE FTE Ontario Provincial Police 2014 Municipal Policing Cost Recovery Formula Comparison Estimated Constable Cost The 2015 costs incorporate the 2014 Municipal Cost-Recovery Formula rates. The 2014 costs incorporate the 2013 Municipal Cost-Recovery Formula rates. Differential Category 2015 2014 $ % Constable Salary and Benefits Salary(2014 Rate)** $94,6991 $94,699 $0 0.0% Overtime ** $4,830 5.1% $6,250 6.6% $1,420-22.7% Contractual Payout (Vacation & Statutory Holidays) $3,599 3.8% $3,599 3.8% $0 0.0% Shift Premiums $678 $675 $3 0.4% Benefits (26.6% of salary for 2014 formula, 27.34% salary for 2015 formula and 2% overtime) $25,987 $25,3151 $672 2.7% Total Constable Salary and Benefits $129,793 $130,538 -$745 -0.6% $5,164 $1,358 $389 $117 $3,858 $10,886 $538 10.4% -$6 -0.4% $41 10.5% $11 9.4% $403 10.4% $987 9.1% Support Staff Costs (Salaries and Benefits) Communication Operators $5,702 Prisoner Guards $1,352 Office Automation Support $430 Telephone Support $128 Operational Support $4,261 Sub-total Support Staff Costs $11,873 Other Direct Operating Expenses (ODOE) Communication Centre $250 Operational Support $750 Office Automation $1,401 Telephone $1,200 Vehicle Usage $8,229 Uniform & Equipment $1,223 Detachment Supplies and Equipment $503 Mobile Radio Equipment Maintenance $804 Accommodation $563 Cleaning Contract $465 RHQ Municipal Support $2,194 Sub-total ODOE Support Costs $17,582 $254 $903 $1,402 $1,132 $8,058 $1,174 $530 $791 $588 $303 $2,006 $17,141 -$4 -1.6% -$153-16.9% -$1 -0.14 $68 6.0% $171 2.1% $49 4.2% -$27 -5.14 $13 1.6% -$25 -4.3% $162 53.5% $188) 9.4% $441 2.6% $28,027 $1,428 5.1% Total Support Costs $29,455 Total Estimated Constable Cost $159,248 $158,565 $683 0.4% ** These costs are reconciled to actuals each year. The salary rate is based on the average of all 1st Class Constable 2014 rates. Overtime and Contractual Payouts are estimated based on fiscal 2013-2014 cost. Source: Created by author using data provided by Ontario Provincial Police. EXHIBIT 2: TOTAL BASE SERVICE AND CALLS FOR SERVICE COST SUMMARY OPP Total Base Service and Calls for Service Cost Summary For the Period of January 1 to December 31, 2015 CATEGORY Total uniform salaries & benefits Total detachment civilian salaries & benefits Total support staff salaries & benefits costs Total salaries & benefits Total other direct operating expenses Total municipal base and calls for service cost Total OPP-policed municipal properties (per exhibit E) Base service cost per property CALLS FOR FTE's BASE SERVICE TOTAL SERVICE 2,237.47 $ 173,098,725 $ 107,444,219 $ 280,542,944 192.32 $ 8,932,506 $ 5,928,200 $ 14,860,706 $ 16,279,664 $ 10,285,817 $ 26,565,481 $ 198,310,895 $ 123,658,236 $ 321,969,131 $ 22,883,486 $ 14,464,157 $ 37,347,643 $ 221,194,381 $ 138,122,393 $ 359,316,774 1,128,798 $ 195.96 Source: Created by author using data provided by Ontario Provincial Police. EXHIBIT 3: 2015 CALLS FOR SERVICE SUMMARY: ALL SERVICE AREAS For the Period of January 1 to December 31, 2015 CALLS FOR SERVICE COUNT A B C=A B CALLS FOR SERVICE BILLING WORKGROUPS 2010 2011 2012 2013 AVERAGE AVERAGE TOTAL CALLS FOR STANDARD WEIGHTED SERVICE TIME (HRS) TIME (HRS) 5.402 All Service Areas Drug Possession Drugs Operational Operational 2 Other Criminal Code Violations Property Crime Violations 5.694 1.953 153.509 100.135 13.346 55.911 21.570 37.855 21,835 411,805 5.749 1.914 154.697 99.668 12.845 57.450 23.186 35.418 21,866 412,790 1.718 150.970 91.720 11.127 49.534 22.410 37.288 19,060 389,229 5.047 1.358 151.569 90.863 10.637 46.065 22.231 37.720 17,658 383,148 5.473 1.736 152.686 95.597 11.989 52.240 22.349 37.070 20,105 399,243 6.20 34.10 3.50 1.10 7.40 6.40 3.10 3.30 14.80 33.931.05 59.180.55 534.401.88 105.156.15 88.716.75 334,334.40 69.281.90 122.331.00 297,546.60 1,644,880.28 Statutes Traffic Violent Criminal Code Total Source: Created by author using data provided by Ontario Provincial Police. EXHIBIT 5: MUNICIPALITY INFORMATION CATEGORY ALDER BALSAM CEDAR TOTAL SERVICE AREA East Central North West N/A 14,220 27,221 2,370 2,146,789 17.24 22.37 12.90 1,035,573 824.83 1,216.85 183.72 2.07 4,430 15,082 671 1,069,951 529 81 58,847 4,732 15,611 752 1,128,798 $ 49,769 $ 82,179 $62,456 $78,160 3.21 1.80 3.53 2.01 $891,836,576 $3,695,312,326 $280,010,747 $ 276,024,606,014 $ 188,469 $ 236,712 $372,355 $244,530 2011 2013 2009 N/A $364.38 $ 392.13 $173.82 N/A Region Population Area (km) Population density (km) Households Commercial/industrial properties Total property count Average household income Average household size (people) Total property assessment Average property assessment Year of previous contract Cost per property per previous contract 302
Step by Step Solution
There are 3 Steps involved in it

Get step-by-step solutions from verified subject matter experts