Answered step by step
Verified Expert Solution
Question
1 Approved Answer
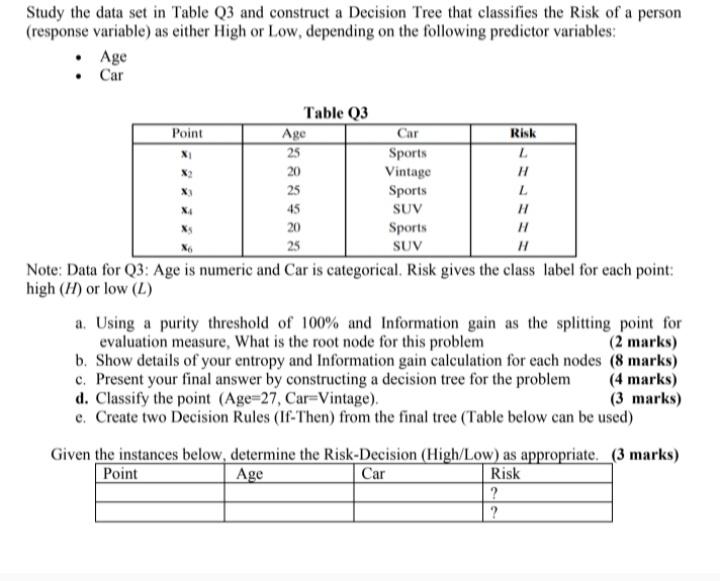
X H Study the data set in Table Q3 and construct a Decision Tree that classifies the Risk of a person (response variable) as either
Step by Step Solution
There are 3 Steps involved in it
Step: 1

Get Instant Access to Expert-Tailored Solutions
See step-by-step solutions with expert insights and AI powered tools for academic success
Step: 2

Step: 3
Ace Your Homework with AI
Get the answers you need in no time with our AI-driven, step-by-step assistance
Get Started