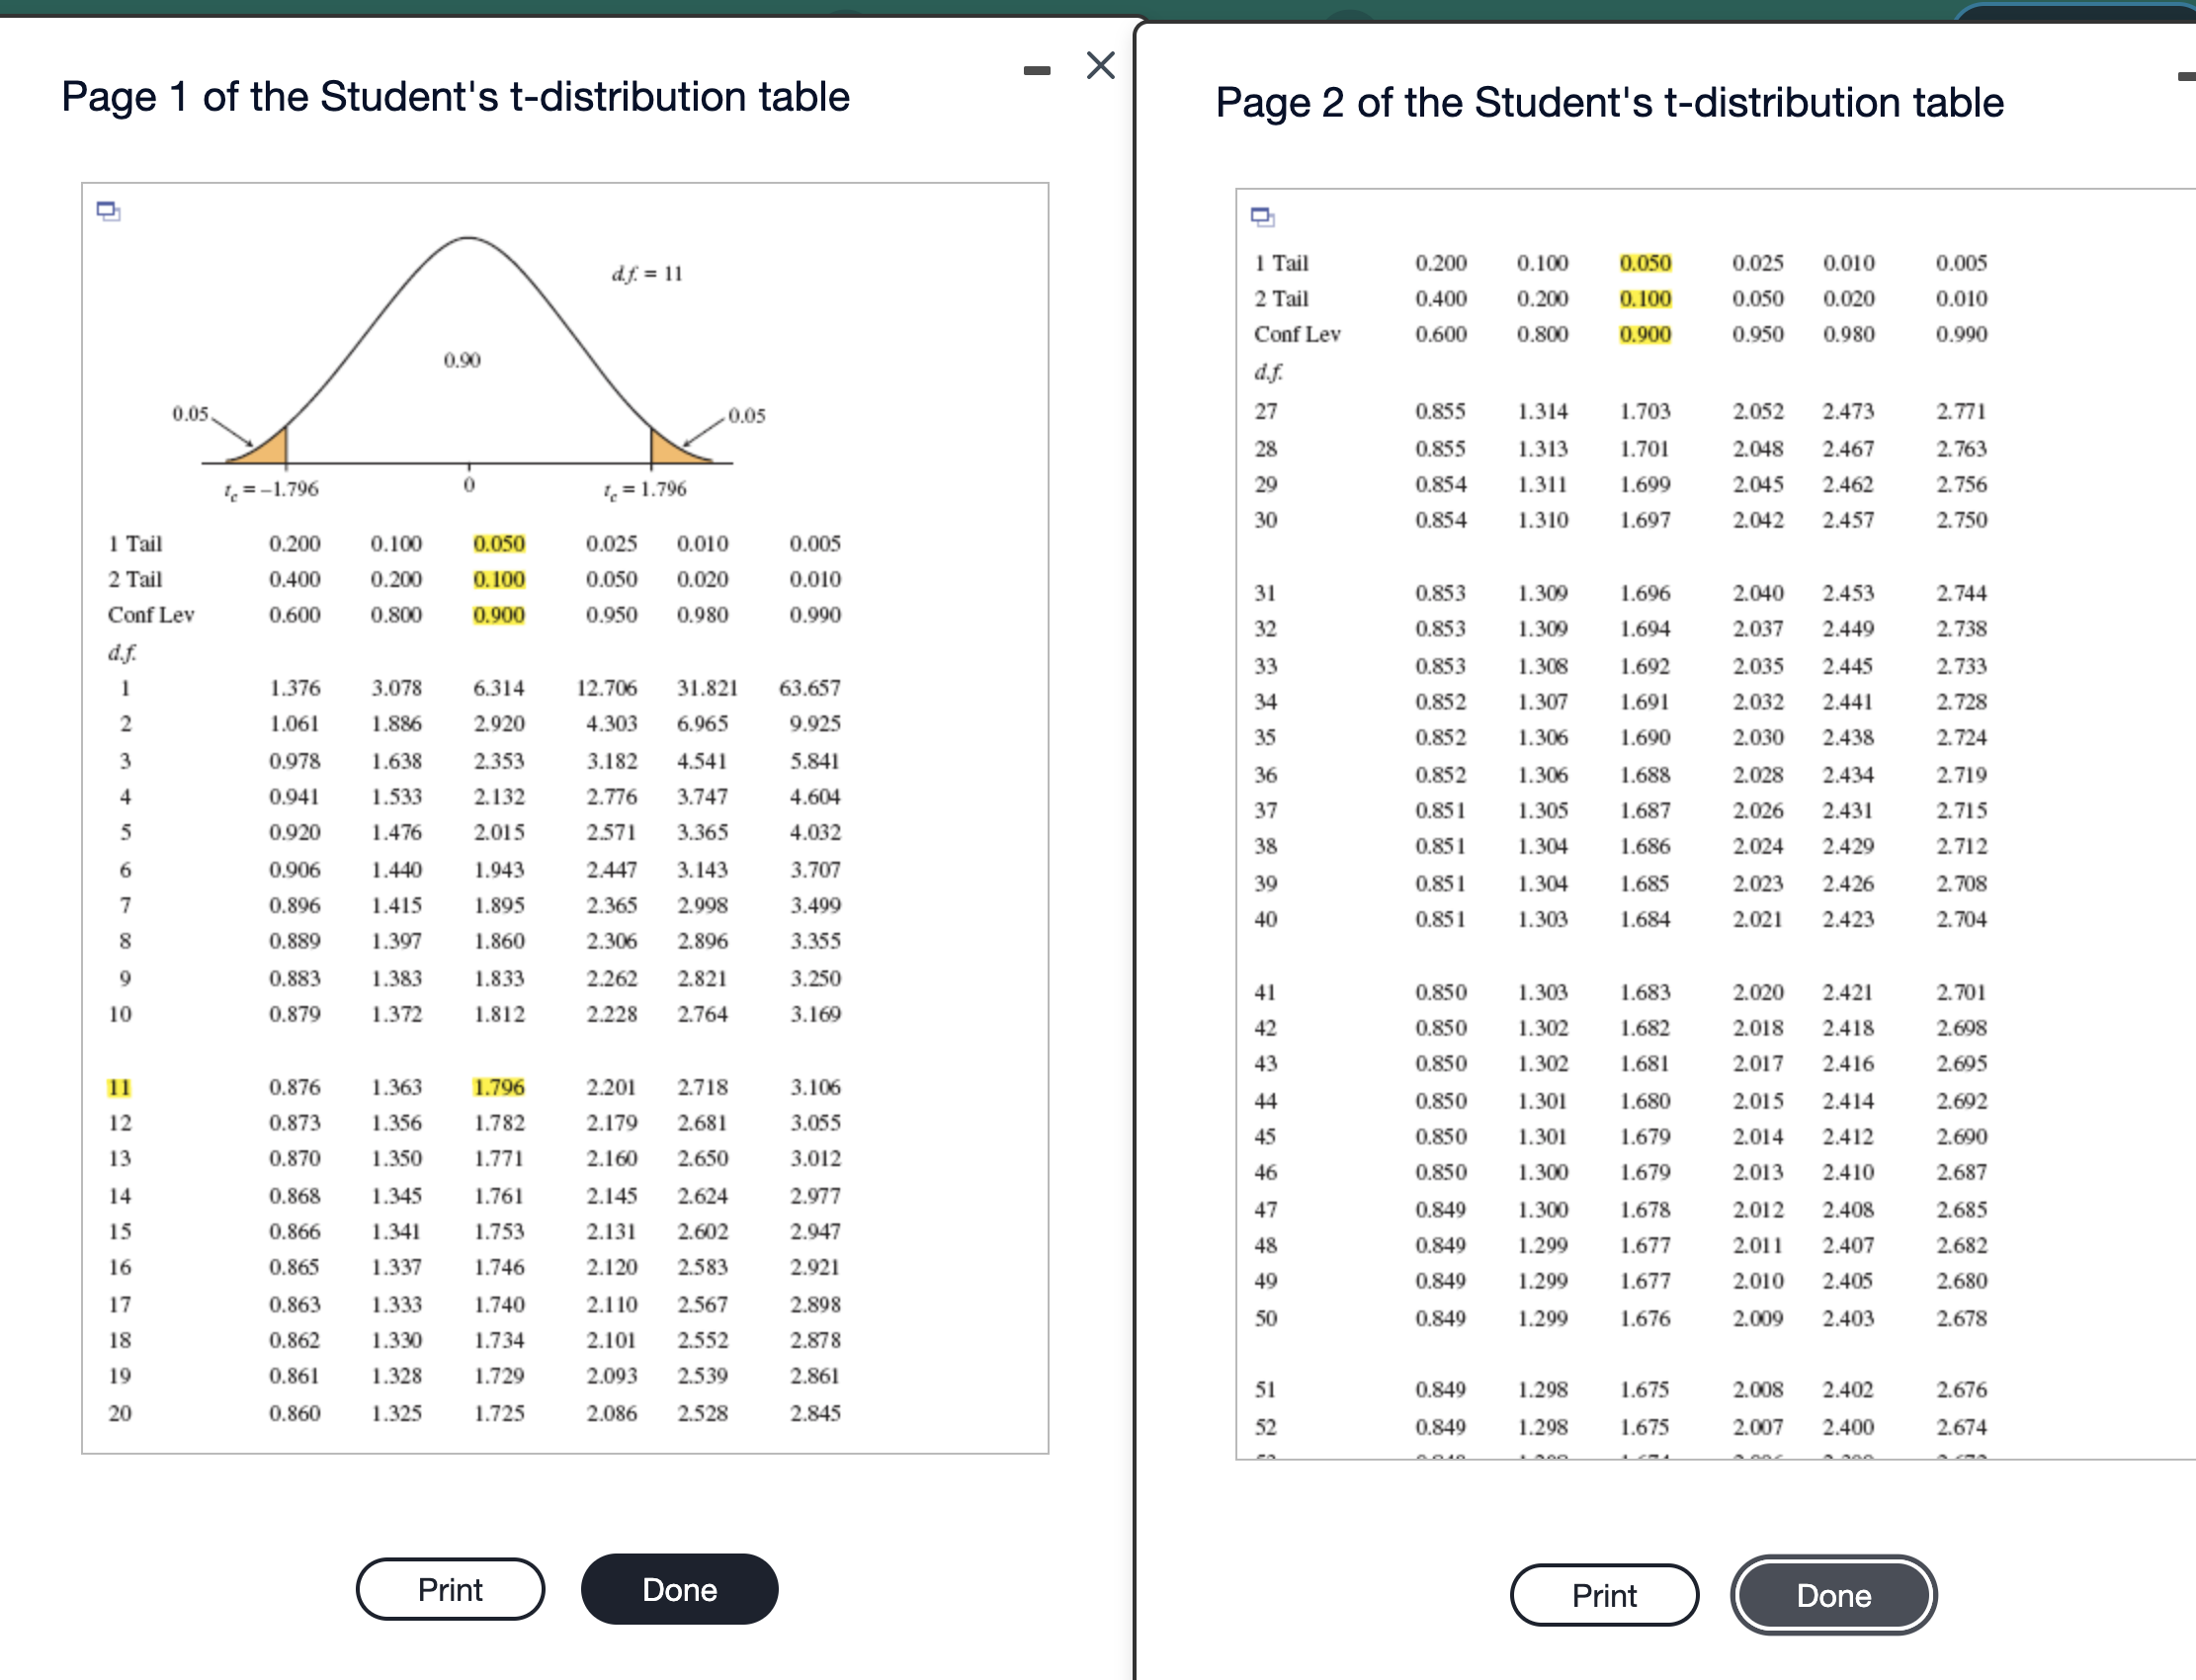
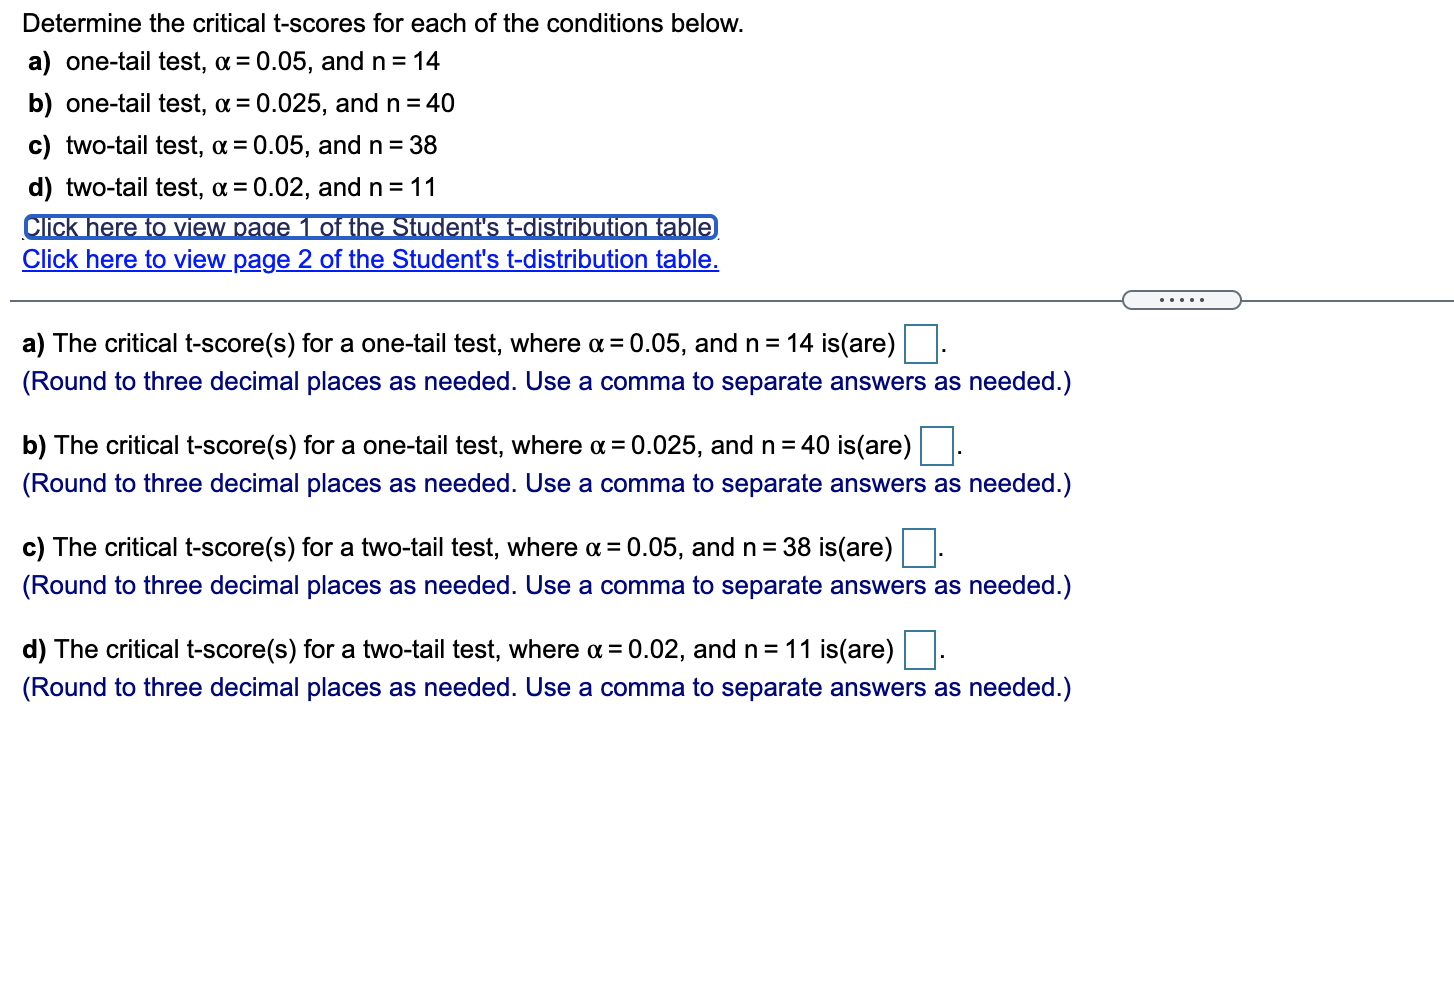
- X Page 1 of the Student's t-distribution table Page 2 of the Student's t-distribution table d.f. = 11 1 Tail 0.200 0.100 0.050 0.025 0.010 0.005 2 Tail 0.400 0.200 0.100 0.050 0.020 0.010 Conf Lev 0.600 0.800 0.900 0.950 0.980 0.990 0.90 d.f 0.0: 0.05 27 0.855 1.314 1.703 2.052 2.473 2.771 28 0.855 1.313 1.701 2.048 2.467 2.763 te =-1.796 le = 1.796 29 0.854 1.311 1.699 2.045 2.462 2.756 30 0.854 1.310 1.697 2.042 2.457 2.750 1 Tail 0.200 0.100 0.050 0.025 0.010 0.005 2 Tail 0.400 0.200 0.100 0.050 0.020 0.010 0.853 1.309 1.696 2.040 2.453 2.744 Conf Lev 0.600 0.800 31 0.900 0.950 0.980 0.990 0.853 1.309 1.694 2.037 2.449 2.738 d.f. 0.853 1.308 1.692 2.035 2.445 2.733 1.376 3.078 6.314 12.706 31.821 63.657 0.852 1.307 1.691 2.032 2.441 2.728 N 1.061 1.886 2.920 4.303 6.965 9.925 0.852 1.306 1.690 2.030 2.438 2.724 0.978 1.63 2.353 3.182 4.541 5.841 0.852 1.306 1.688 2.028 2.434 2.719 0.941 1.53 2.132 2.776 3.747 4.604 0.851 1.305 1.687 2.026 2.431 2.715 0.920 1.47 2.015 2.571 3.365 4.032 a u 0.851 1.304 1.686 2.024 2.429 2.712 0.906 1.440 1.943 2.447 3.143 3.707 0.851 1.304 1.685 2.023 2.426 2. 708 0.896 1.415 1.895 2.365 2.998 3.499 0.851 1.303 1.684 2.021 2.423 2. 704 00 - 0.889 1.397 1.860 2.306 2.896 3.355 0.883 1.383 1.833 2.262 2.821 3.250 0.850 1.303 1.683 2.020 2.421 2.701 10 0.879 1.372 1.812 2.228 2.764 3.169 0.850 1.302 1.682 2.018 2.418 2.698 0.850 1.302 1.681 2.017 2.416 2.695 0.876 1.363 1.796 2.201 2.718 3.106 0.850 1.301 1.680 2.015 2.414 2.692 12 0.873 1.356 1.782 2.179 2.681 3.055 0.850 1,301 1.679 2.014 2.412 2.690 13 0.870 1.350 1.771 2.160 2.650 3.012 0.850 1.300 1.679 2.013 2.410 2.687 14 0.868 1.345 1.761 2.145 2.624 2.97 0.849 1.30 1.678 2.012 2.408 2.685 15 0.866 1.341 1.753 2.131 2.602 2.94 0.849 1.299 1.677 2.01 1 2.407 2.682 16 0.865 1.337 1.746 2.120 2.583 2.92 0.849 1.299 1.677 2.010 2.405 2.680 17 0.863 1.33 1.740 2.1 10 2.567 2.898 0.849 1.299 1.676 2.009 2.403 2.678 18 0.862 1.330 1.734 2.101 2.552 2.878 19 0.861 1.328 1.729 2.093 2.539 2.86 0.849 1.298 1.675 2.008 2.402 2.676 20 51 0.860 1.325 1.725 2.086 2.528 2.845 0.849 1.298 1.675 2.007 2.400 2.674 Print Done Print DoneDetermine the critical t-scores for each of the conditions below. a) one-tail test, or = 0.05, and n = 14 b) one-tail test, or = 0.025, and n = 40 c) two-tail test, 0: = 0.05, and n = 38 d) two-tail test, or = 0.02, and n =11 anaammmmlimmmamrammmma Click here to View p_age 2 of the Student's tdistribution table. a) The critical t-score(s) for a one-tail test, where a = 0.05, and n = 14 is(are) |:|. (Round to three decimal places as needed. Use a comma to separate answers as needed.) b) The critical tscore(s) for a one-tail test, where (x = 0.025, and n = 40 is(are) |:|. (Round to three decimal places as needed. Use a comma to separate answers as needed.) c) The critical t-score(s) for a two-tail test, where a = 0.05, and n = 38 is(are) |:|. (Round to three decimal places as needed. Use a comma to separate answers as needed.) cl) The critical t-score(s) for a two-tail test, where or = 0.02, and n = 11 is(are) |:|. (Round to three decimal places as needed. Use a comma to separate answers as needed.)


