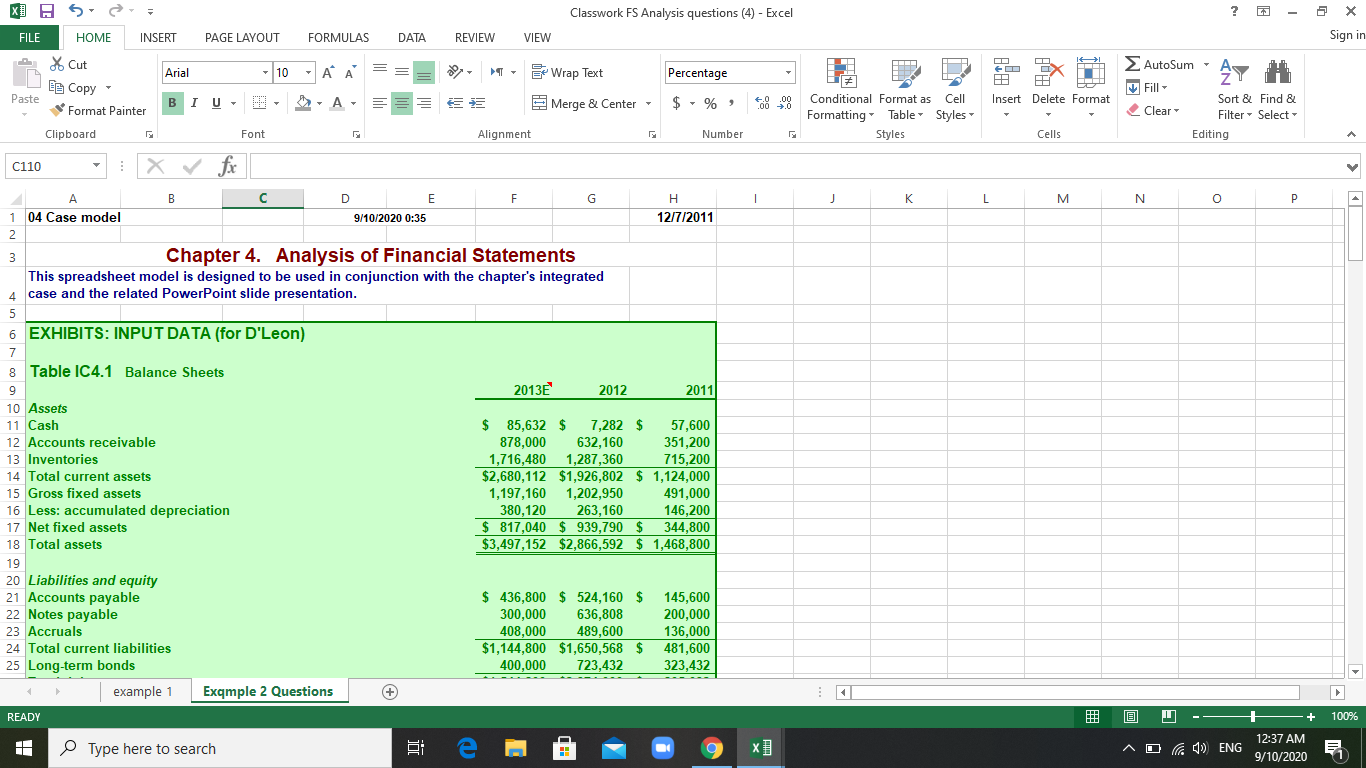
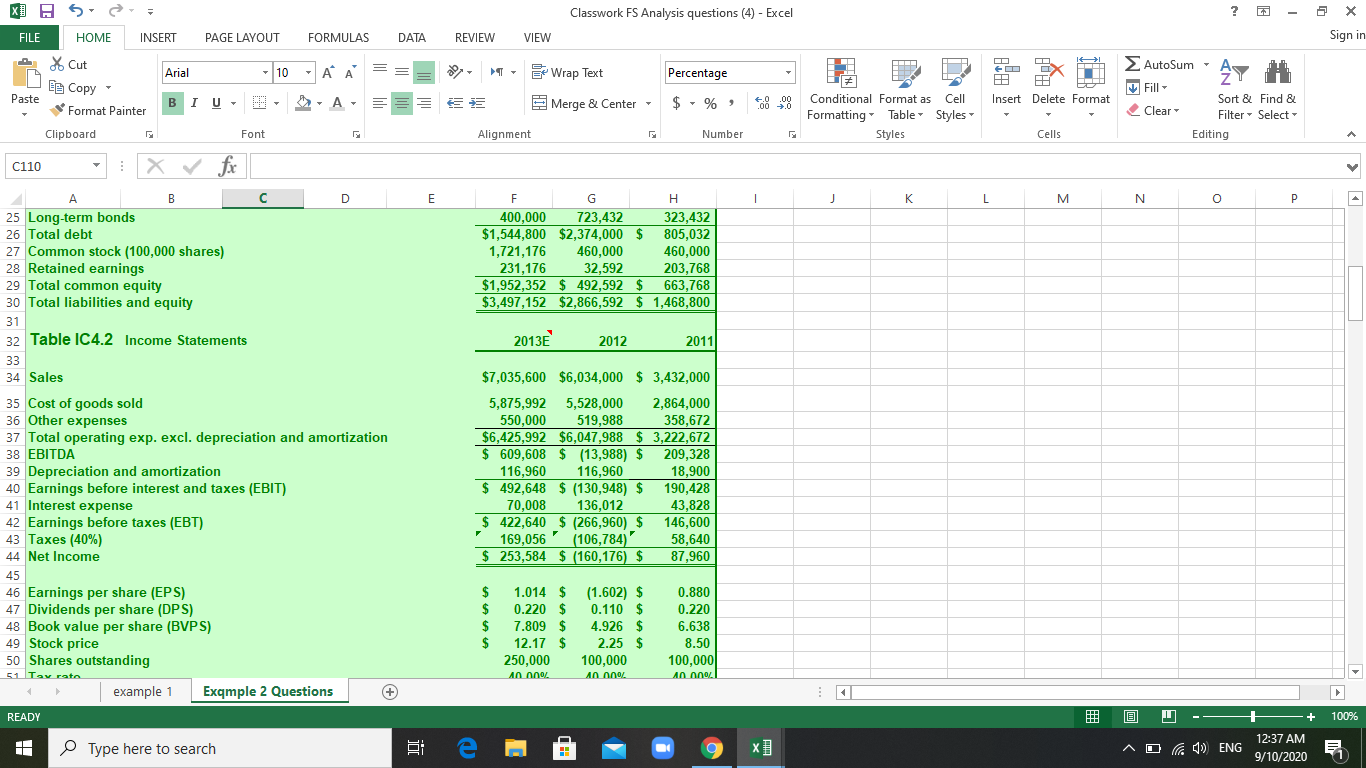
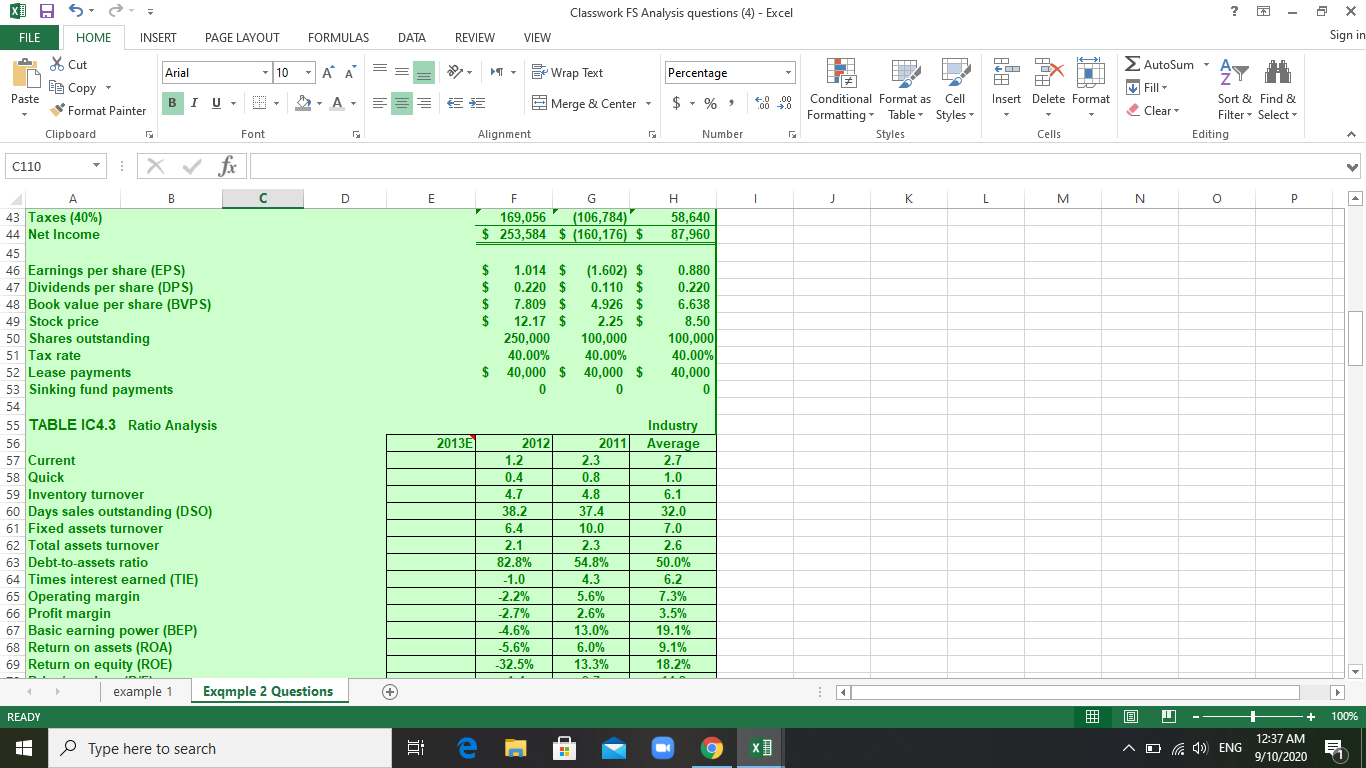
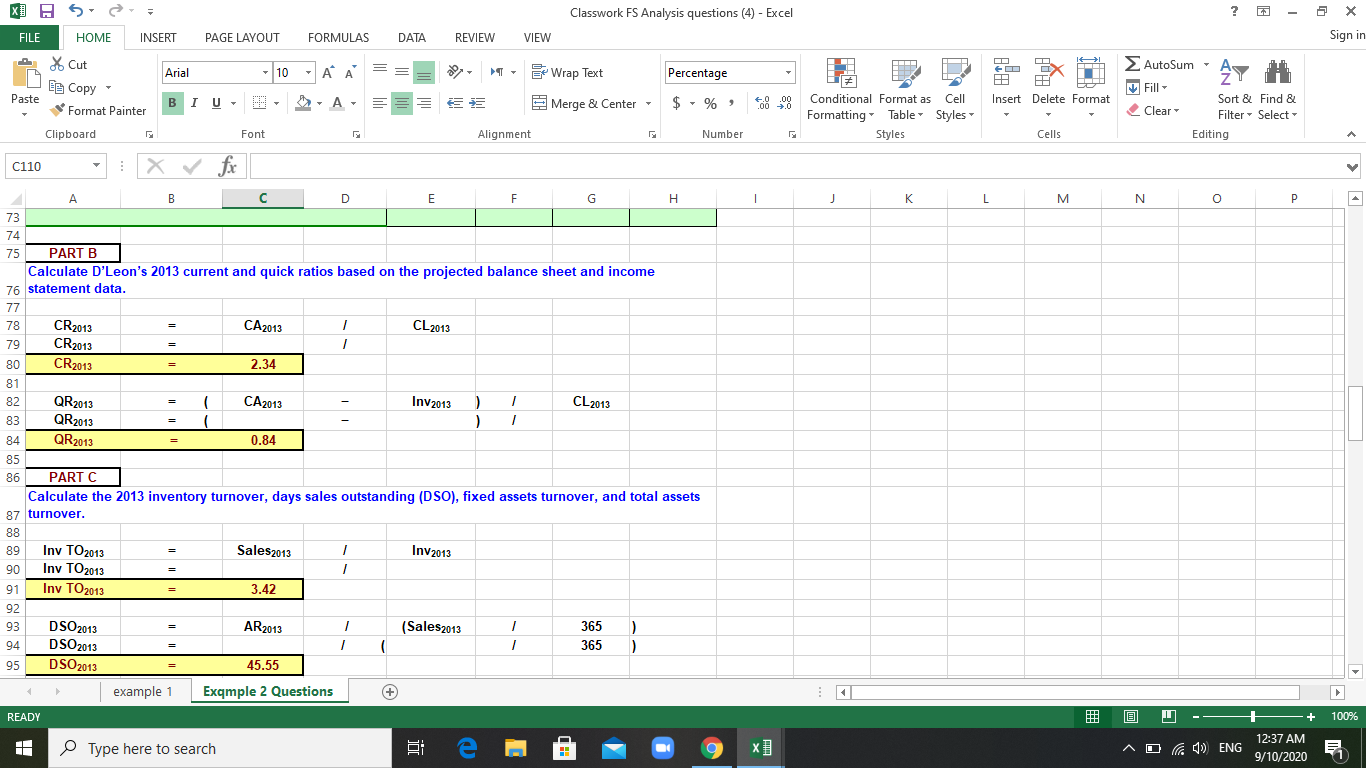
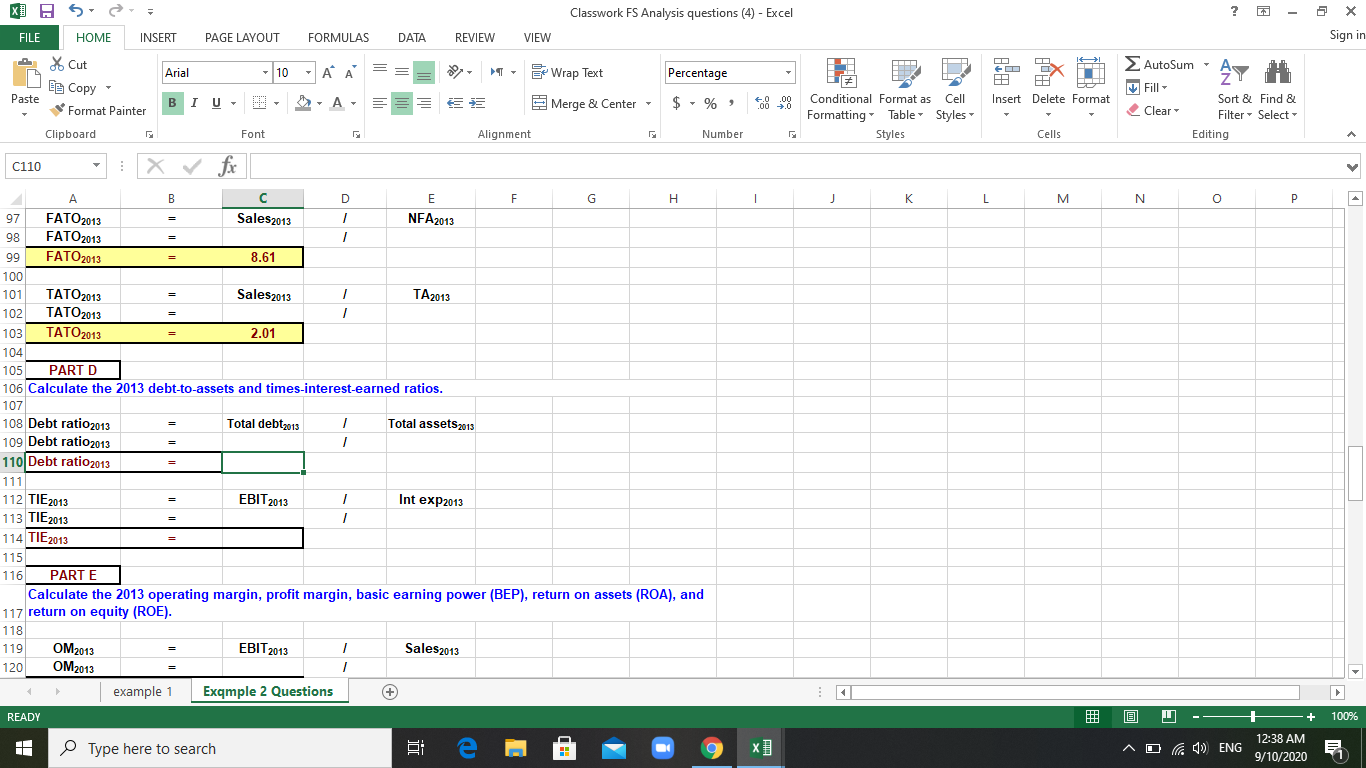
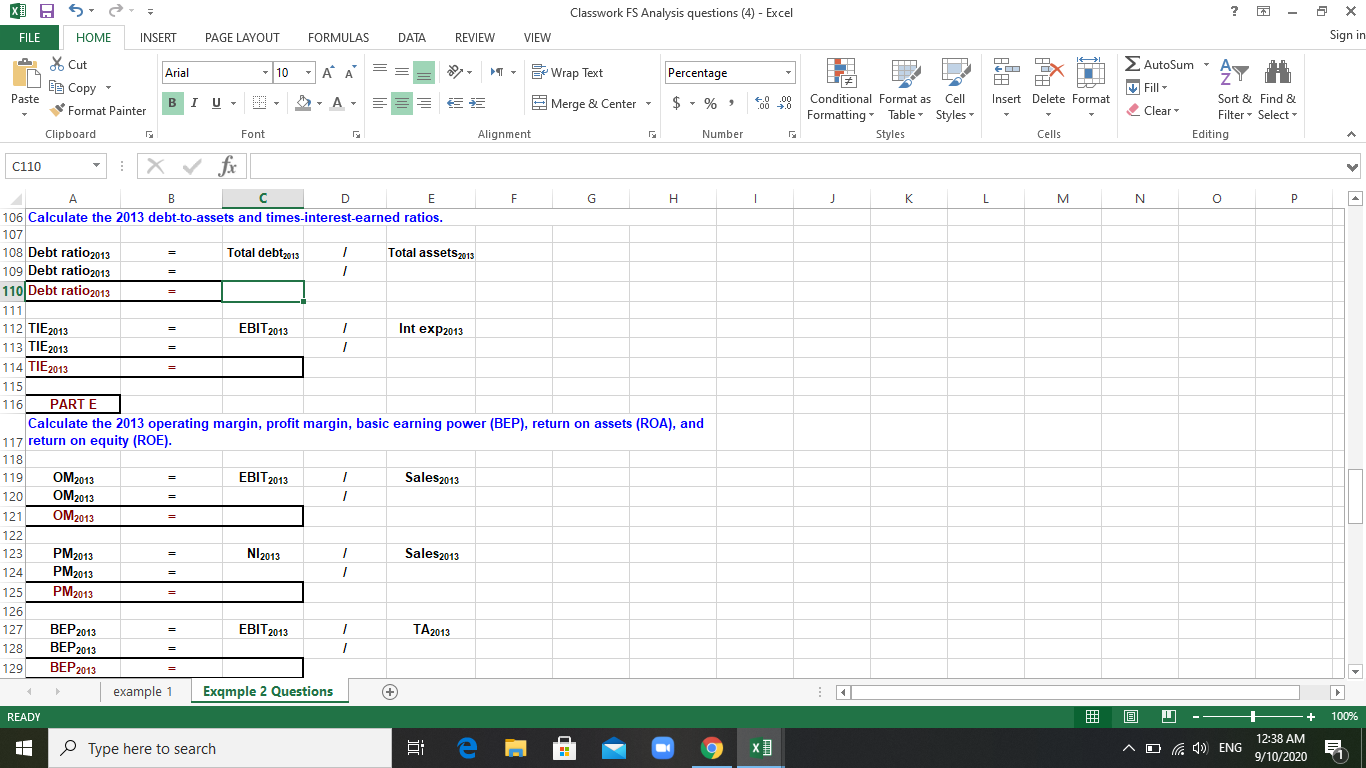
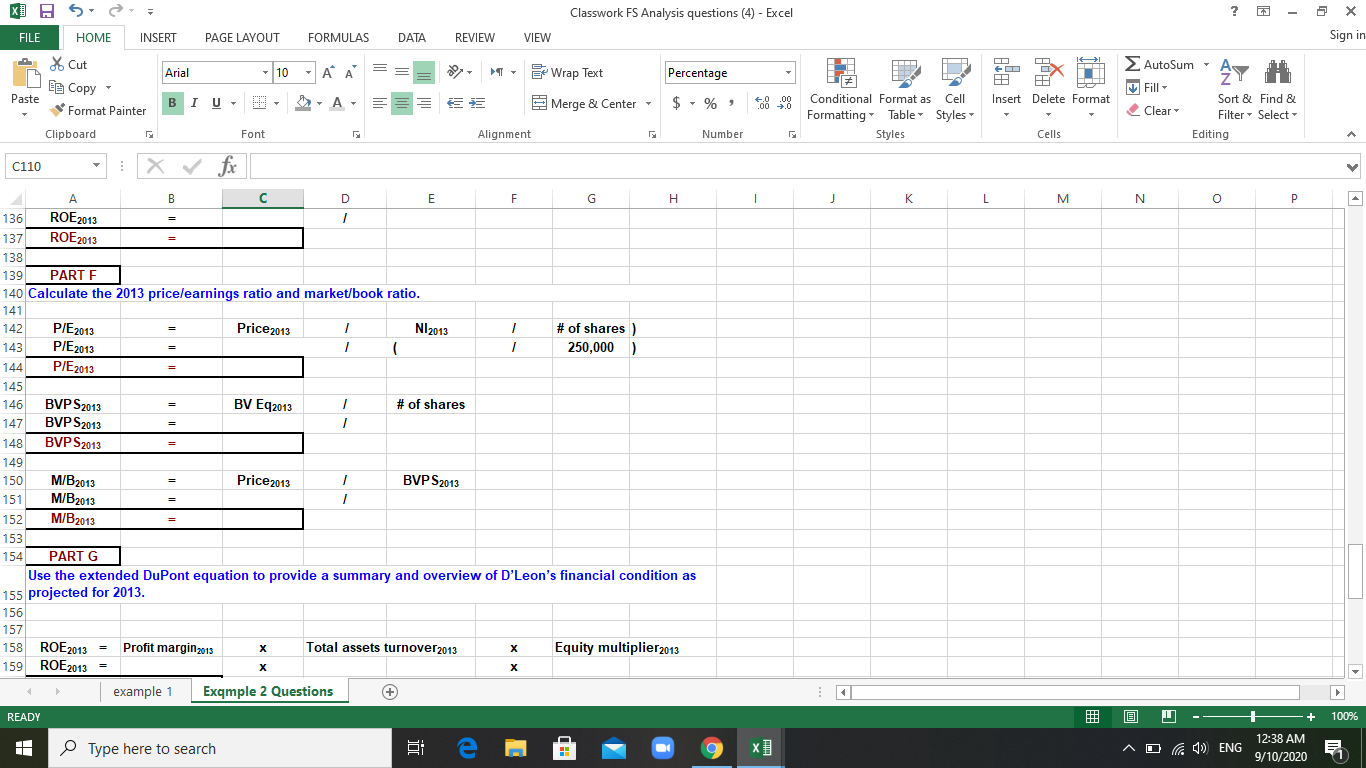
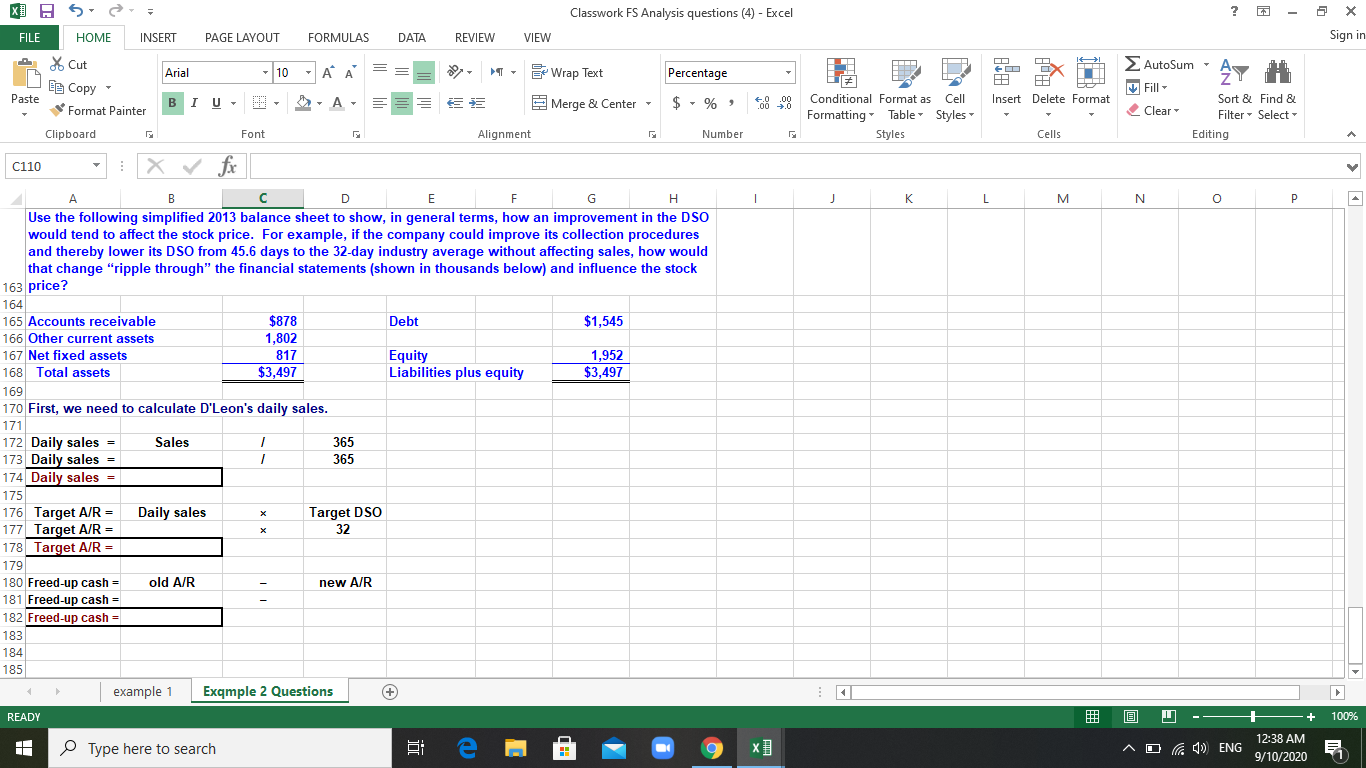
XI 5 = Classwork FS Analysis questions (4) - Excel 6 x FILE HOME INSERT PAGE LAYOUT FORMULAS DATA REVIEW VIEW Sign in Arial 10 AA Wrap Text Percentage % Cut EL Copy Format Painter > X A TI H Insert Delete Format Paste BIU- -A- 95 Merge & Center $ % 4.0 .00 .00 0 Conditional Format as Cell Formatting Table Styles Styles AutoSum - A Z Fill- Sort & Find & Clear Filter - Select - Editing Clipboard Font Alignment Number Cells A C110 : | X fx 1 J J K L M N. o P 4 A B F H 1 04 Case model 9/10/2020 0:35 12/7/2011 2 3 Chapter 4. Analysis of Financial Statements This spreadsheet model is designed to be used in conjunction with the chapter's integrated case and the related PowerPoint slide presentation. 5 5 6 EXHIBITS: INPUT DATA (for D'Leon) 7 8 Table IC4.1 Balance Sheets 9 2013 2012 2011 10 Assets 11 Cash $ 85,632 $ 7,282 $ 57,600 12 Accounts receivable 878,000 632,160 351,200 13 Inventories 1,716,480 1,287,360 715,200 14 Total current assets $2,680,112 $1,926,802 $ 1,124,000 15 Gross fixed assets 1,197,160 1,202,950 491,000 16 Less: accumulated depreciation 380,120 263,160 146.200 17 Net fixed assets $ 817,040 $ 939,790 $ 344,800 18 Total assets $3,497,152 $2,866,592 $ 1,468,800 19 20 Liabilities and equity 21 Accounts payable $ 436,800 $ 524,160 $ 145,600 22 Notes payable 300,000 636,808 200,000 23 Accruals 408,000 489.600 136,000 24 Total current liabilities $1,144,800 $1,650,568 $ 481,600 25 Long-term bonds 400,000 723,432 323,432 example 1 Exqmple 2 Questions READY + 100% Type here to search e 1 D ENG 12:37 AM 9/10/2020 XI 5 = Classwork FS Analysis questions (4) - Excel 6 x FILE HOME INSERT PAGE LAYOUT FORMULAS DATA REVIEW VIEW Sign in Arial 10 A A Wrap Text Percentage Cut ED Copy Format Painter > X A TI H Insert Delete Format Paste BIU A Merge & Center - $ - % 4.0 .00 .00 0 Conditional Format as Cell Formatting Table Styles Styles AutoSum - A Z Fill- Sort & Find & Clear Filter - Select - Editing Clipboard Font Alignment Number Cells C110 : X fx E 1 J J K L M N o P F G H 400,000 723,432 323,432 $1,544,800 $2,374,000 $ 805,032 1,721,176 460,000 460,000 231.176 32,592 203,768 $1,952,352 $ 492,592 $ 663,768 $3,497,152 $2,866,592 $ 1,468,800 2013E 2012 2011 A B D 25 Long-term bonds 26 Total debt 27 Common stock (100,000 shares) 28 Retained earnings 29 Total common equity 30 Total liabilities and equity 31 32 Table IC4.2 Income Statements 33 34 Sales 35 Cost of goods sold 36 Other expenses 37 Total operating exp. excl. depreciation and amortization 38 EBITDA 39 Depreciation and amortization 40 Earnings before interest and taxes (EBIT) 41 Interest expense 42 Earnings before taxes (EBT) 43 Taxes (40%) 44 Net Income 45 46 Earnings per share (EPS) 47 Dividends per share (DPS) 48 Book value per share (BVPS) 49 Stock price 50 Shares outstanding example 1 Exqmple 2 Questions $7,035,600 $6,034,000 $ 3,432,000 5,875,992 5,528,000 2,864,000 550,000 519,988 358,672 $6,425,992 $6,047,988 $ 3,222,672 $ 609,608 $ (13,988) $ 209,328 116,960 116,960 18,900 $ 492,648 $ (130,948) $ 190,428 70,008 136,012 43,828 $ 422,640 $ (266,960) $ 146,600 169,056 (106,784) 58,640 $ 253,584 $ (160,176) $ 87,960 $ $ $ $ 1.014 $ 0.220 $ 7.809 $ 12.17 $ 250,000 /. (1.602) $ 0.110 $ 4.926 $ 2.25 $ 100,000 40 0.880 0.220 6.638 8.50 100,0001 10 000 51 Tovrata READY + 100% Type here to search e . 1 D ENG 12:37 AM 9/10/2020 XI 5 = Classwork FS Analysis questions (4) - Excel 6 x FILE HOME INSERT PAGE LAYOUT FORMULAS DATA REVIEW VIEW Sign in Arial 10 A A Wrap Text Percentage Cut Be Copy Format Painter > X A H Insert Delete Format Paste BIU A Merge & Center $ - % 4.0 .00 .00 0 Conditional Format as Cell Formatting Table Styles Styles AutoSum - A Z Fill- Sort & Find & Clear Filter - Select- Editing Clipboard Font Alignment Number [5 Cells C110 1 X fx E 1 J J K L M N. o F G 169,056 (106,784) $ 253,584 $ (160,176) $ H 58,640 87,960 $ 1.014 $ (1.602) $ $ 0.220 $ 0.110 $ $ 7.809 $ 4.926 $ $ 12.17 $ 2.25 $ 250,000 100,000 40.00% 40.00% $ 40,000 $ 40,000 $ 0 0 0.880 0.220 6.638 8.50 100,000 40.00% 40,000 0 A B D 43 Taxes (40%) 44 Net Income 45 46 Earnings per share (EPS) 47 Dividends per share (DPS) 48 Book value per share (BVPS) 49 Stock price 50 Shares outstanding 51 Tax rate 52 Lease payments 53 Sinking fund payments 54 55 TABLE IC4.3 Ratio Analysis 56 57 Current 58 Quick 59 Inventory turnover 60 Days sales outstanding (DSO) 61 Fixed assets turnover 62 Total assets turnover 63 Debt-to-assets ratio 64 Times interest earned (TIE) 65 Operating margin 66 Profit margin 67 Basic earning power (BEP) 68 Return on assets (ROA) 69 Return on equity (ROE) example 1 Exqmple 2 Questions 2013E 2012 1.2 0.4 4.7 38.2 6.4 2.1 82.8% -1.0 -2.2% -2.7% 4.6% -5.6% -32.5% 2011 2.3 0.8 4.8 37.4 10.0 2.3 54.8% 4.3 5.6% 2.6% 13.0% 6.0% 13.3% A) Industry Average 2.7 1.0 6.1 32.0 7.0 2.6 50.0% 6.2 7.3% 3.5% 19.1% 9.1% 18.2% + READY + 100% Type here to search e 1 D ENG 12:37 AM 9/10/2020 XI 5 = Classwork FS Analysis questions (4) - Excel 6 x FILE HOME INSERT PAGE LAYOUT FORMULAS DATA REVIEW VIEW Sign in Arial 10 AA Wrap Text Percentage * Cut ED Copy Format Painter > X A TI H Insert Delete Format Paste BIU- -A- 95 Merge & Center $ % 4.0 .00 .00 0 Conditional Format as Cell Formatting Table Styles Styles AutoSum - A Z Fill- Sort & Find & Clear Filter - Select - Editing Clipboard Font Alignment [5 Number Cells C110 X fx 1 J K L M N o P = A B D E F G H 73 74 75 PART B Calculate D'Leon's 2013 current and quick ratios based on the projected balance sheet and income 76 statement data. 77 78 CR2013 CA2013 1 CL 2013 79 CR 2013 1 80 CR 2013 2.34 81 82 QR2013 ( CA2013 In 2013 ) 1 CL 2013 83 QR2013 ( ) 1 84 QR 2013 0.84 85 86 PARTC Calculate the 2013 inventory turnover, days sales outstanding (DSO), fixed assets turnover, and total assets 87 turnover. 88 89 Inv TO 2013 Sales2013 1 In 2013 90 Inv TO 2013 1 91 Inv TO 2013 3.42 92 93 D SO 2013 AR2013 1 (Sales2013 1 365 ) 94 DSO 2013 1 ( 1 365 ) 95 DSO 2013 45.55 example 1 Exqmple 2 Questions + READY 3 + 100% Type here to search in e 1 D ENG 12:37 AM 9/10/2020 XI 5 = Classwork FS Analysis questions (4) - Excel 6 x FILE HOME INSERT PAGE LAYOUT FORMULAS DATA REVIEW VIEW Sign in Arial 10 AA Wrap Text Percentage * Cut ED Copy Format Painter > X A TI H Insert Delete Format Paste BIU- -A- 3 Merge & Center $ - % 4.0 .00 .00 0 Conditional Format as Cell Formatting Table Styles Styles AutoSum - A Z Fill- Sort & Find & Clear Filter - Select - Editing Clipboard Font Alignment [5 Number Cells 1 J J K L M N O P C110 X fx A B C D E F H 97 FATO 2013 Sales2013 1 1 NFA2013 98 FATO 2013 99 FATO 2013 8.61 100 101 TATO 2013 Sales2013 1 TA2013 102 TATO 2013 1 103 TATO 2013 2.01 104 105 PART D 106 Calculate the 2013 debt-to-assets and times-interest-earned ratios. 107 108 Debt ratio 2013 Total debt2013 1 Total assets 2013 109 Debt ratio 2013 1 110 Debt ratio 2013 111 112 TIE 2013 EBIT 2013 1 113 TIE 2013 1 114 TIE 2013 115 116 PARTE Calculate the 2013 operating margin, profit margin, basic earning power (BEP), return on assets (ROA), and 117 return on equity (ROE). 118 119 OM 2013 1 Sales2013 120 1 example 1 Exqmple 2 Questions + Int exp2013 EBIT 2013 OM 2013 READY + 100% Type here to search e 1 D ENG 12:38 AM 9/10/2020 XI 5 = Classwork FS Analysis questions (4) - Excel 6 x FILE HOME INSERT PAGE LAYOUT FORMULAS DATA REVIEW VIEW Sign in Arial 10 AA Wrap Text Percentage * Cut ED Copy Format Painter > X A TI H Insert Delete Format Paste BIU -A- 95 Merge & Center - $ % ) 4.0 .00 .00 0 Conditional Format as Cell Formatting Table Styles Styles AutoSum - A Z Fill- Sort & Find & Clear Filter - Select - Editing Clipboard Font Alignment [5 Number Cells A V 1 J K L M N o P EBIT 2013 Int exp2013 C110 : | X fix A B D E F H 106 Calculate the 2013 debt-to-assets and times-interest-earned ratios. 107 108 Debt ratio 2013 Total debt2013 1 Total assets 2013 109 Debt ratio 2013 1 110 Debt ratio 2013 111 112 TIE 2013 1 113 TIE 2013 1 114 TIE 2013 115 116 PARTE Calculate the 2013 operating margin, profit margin, basic earning power (BEP), return on assets (ROA), and 117 return on equity (ROE). 118 119 OM 2013 1 Sales2013 120 OM 2013 1 121 122 123 PM2013 NI 2013 1 Sales2013 124 125 PM2013 126 127 1 TA2013 128 BEP2013 1 7 129 example 1 Exqmple 2 Questions + EBIT 2013 OM 2013 PM2013 BEP2013 EBIT 2013 BEP 2013 READY + 100% Type here to search B e 1 D ENG 12:38 AM 9/10/2020 XI 5 = Classwork FS Analysis questions (4) - Excel 6 x FILE HOME INSERT PAGE LAYOUT FORMULAS DATA REVIEW VIEW Sign in Arial 10 AA Wrap Text Percentage * Cut ED Copy Format Painter > X A TI H Insert Delete Format Paste BIU- -A- 3 Merge & Center $ - % 4.0 .00 .00 0 Conditional Format as Cell Formatting Table Styles Styles AutoSum-A Z Fill- Sort & Find & Clear Filter - Select - Editing Clipboard Font Alignment Number Cells C110 1 x fc 1 1 J K L M N o P A B D E F H 136 ROE 2013 1 137 ROE 2013 138 139 PARTF 140 Calculate the 2013 pricelearnings ratio and market/book ratio. 141 142 P/E 2013 Price 2013 1 NI 2013 1 # of shares) 143 P/E 2013 / ( 1 250,000) 144 P/E 2013 145 146 BVP S2013 BV EC2013 1 # of shares 147 BVP S2013 1 1 148 BVP S2013 149 150 M/B2013 Price 2013 1 BVP S2013 151 1 152 M/B2013 153 154 PARTG Use the extended DuPont equation to provide a summary and overview of D'Leon's financial condition as 155 projected for 2013. 156 157 158 ROE 2013 = Profit margin 2013 Total assets turnover 2013 Equity multiplier 2013 159 ROE2013 = example 1 Exqmple 2 Questions + M/B2013 x READY + 100% Type here to search e 1 D ENG 12:38 AM 9/10/2020 XI 5 = Classwork FS Analysis questions (4) - Excel 6 x FILE HOME INSERT PAGE LAYOUT FORMULAS DATA REVIEW VIEW Sign in Arial 10 AA Wrap Text Percentage * Cut ED Copy Format Painter > X A H Insert Delete Format Paste BIU -A- 95 Merge & Center - $ - % 4.0 .00 .00 0 Conditional Format as Cell Formatting Table Styles Styles AutoSum - A Z Fill- Sort & Find & Clear Filter Select Editing Clipboard Font Alignment Number Cells C110 1 X fx 1 1 J K L M N o A B D E F G H Use the following simplified 2013 balance sheet to show, in general terms, how an improvement in the DSO would tend to affect the stock price. For example, if the company could improve its collection procedures and thereby lower its DSO from 45.6 days to the 32-day industry average without affecting sales, how would that change "ripple through the financial statements (shown in thousands below) and influence the stock 163 price? 164 165 Accounts receivable $878 Debt $1,545 166 Other current assets 1,802 167 Net fixed assets 817 Equity 1,952 168 Total assets $3,497 Liabilities plus equity $3,497 169 170 First, we need to calculate D'Leon's daily sales. 171 172 Daily sales - Sales / 365 173 Daily sales = 1 365 174 Daily sales = 175 176 Target A/R = Daily sales Target DSO 177 Target A/R = 32 178 Target A/R - 179 180 Freed-up cash = old A/R new AIR 181 Freed-up cash = 182 Freed-up cash = 183 184 185 example 1 Exqmple 2 Questions + 1 READY + 100% Type here to search e 1 D ENG 12:38 AM 9/10/2020