

Answered step by step
Verified Expert Solution
Question
1 Approved Answer
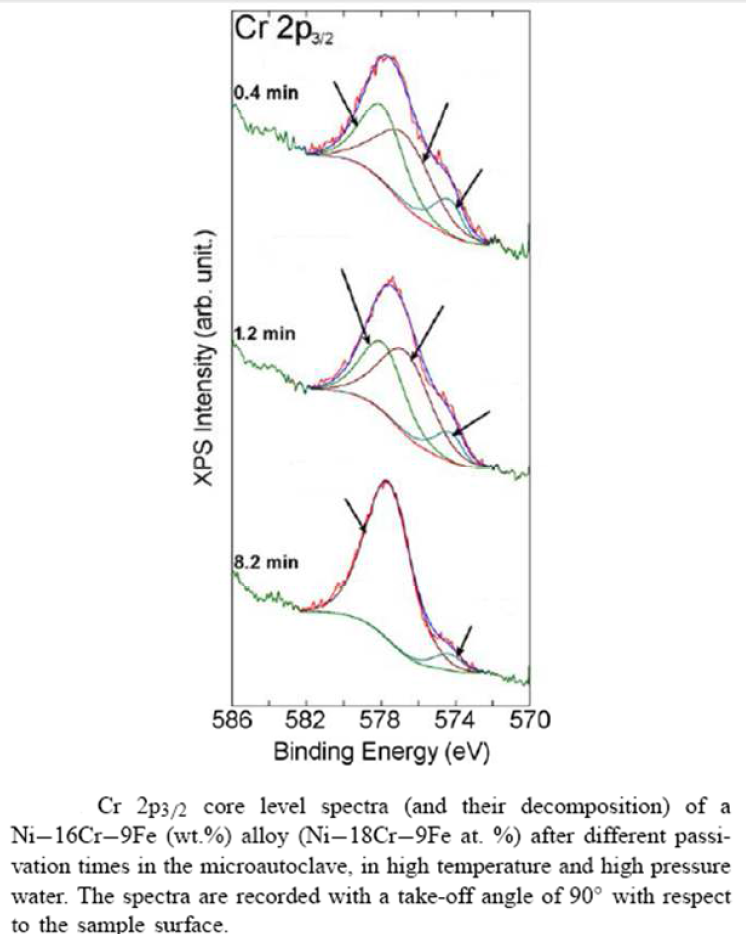
XPS diagrams of Cr 2p3/2 (For Ni-Cr-Fe alloy) after different passivation time are presented in following figure. Explain all variation in these diagrams. Cr 2p22
XPS diagrams of Cr 2p3/2 (For Ni-Cr-Fe alloy) after different passivation time are presented in following figure. Explain all variation in these diagrams.
Step by Step Solution
There are 3 Steps involved in it
Step: 1

Get Instant Access to Expert-Tailored Solutions
See step-by-step solutions with expert insights and AI powered tools for academic success
Step: 2

Step: 3
Ace Your Homework with AI
Get the answers you need in no time with our AI-driven, step-by-step assistance
Get Started
Water Quality Engineering Physical Chemical Treatment Processes
Authors: Mark M. Benjamin, Desmond F. Lawler
1st Edition
1118169654, 9781118169650