

Question
x=t^3-2*t+9 ve y=6*t*t , z=t^2+7 erilerinin grafiklerini tnin 1 ile 5 arasnda 0.02 adm bykl ile deien deerleri iin aadaki aklamalara gre izen MATLAB programn
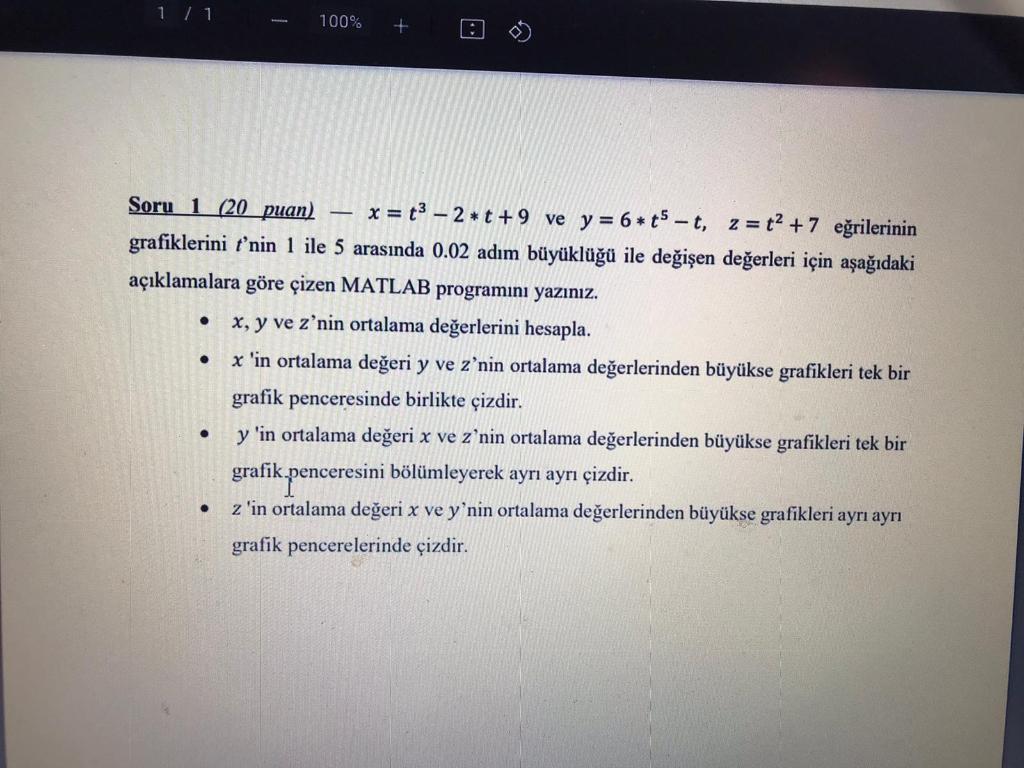
x=t^3-2*t+9 ve y=6*t*t , z=t^2+7 erilerinin grafiklerini tnin 1 ile 5 arasnda 0.02 adm bykl ile deien deerleri iin aadaki aklamalara gre izen MATLAB programn yaznz.
- x, y , znin ortalama deerlerini hesapla.
- x'in ortalama deeri y ve znin ortalama deerlerinden bykse grafikleri tek bir grafik penceresinde birlikte izdir.
- z 'in ortalama deeri x ve ynin ortalama deerlerinden bykse grafikleri ayr ayr grafik pencerelerinde izdir.
x=t^3-2*t+9 ve y=6*t*t , z=t^2+7 Write the MATLAB program that draws the graphs of the curves according to the explanations below for the values of t ranging from 1 to 5 with 0.02 step size.
- Calculate the mean values of x, y, z.
- If the average value of x is greater than the average value of y and z, draw the graphs together in a single graphic window.
- If the average value of z is greater than the average values of x and y, draw the graphs in separate graphics windows.
Step by Step Solution
There are 3 Steps involved in it
Step: 1

Get Instant Access to Expert-Tailored Solutions
See step-by-step solutions with expert insights and AI powered tools for academic success
Step: 2

Step: 3
Ace Your Homework with AI
Get the answers you need in no time with our AI-driven, step-by-step assistance
Get Started
Machine Learning And Knowledge Discovery In Databases European Conference Ecml Pkdd 2022 Grenoble France September 19 23 2022 Proceedings Part 4 Lnai 13716
Authors: Massih-Reza Amini ,Stephane Canu ,Asja Fischer ,Tias Guns ,Petra Kralj Novak ,Grigorios Tsoumakas
1st Edition
3031264118, 978-3031264115