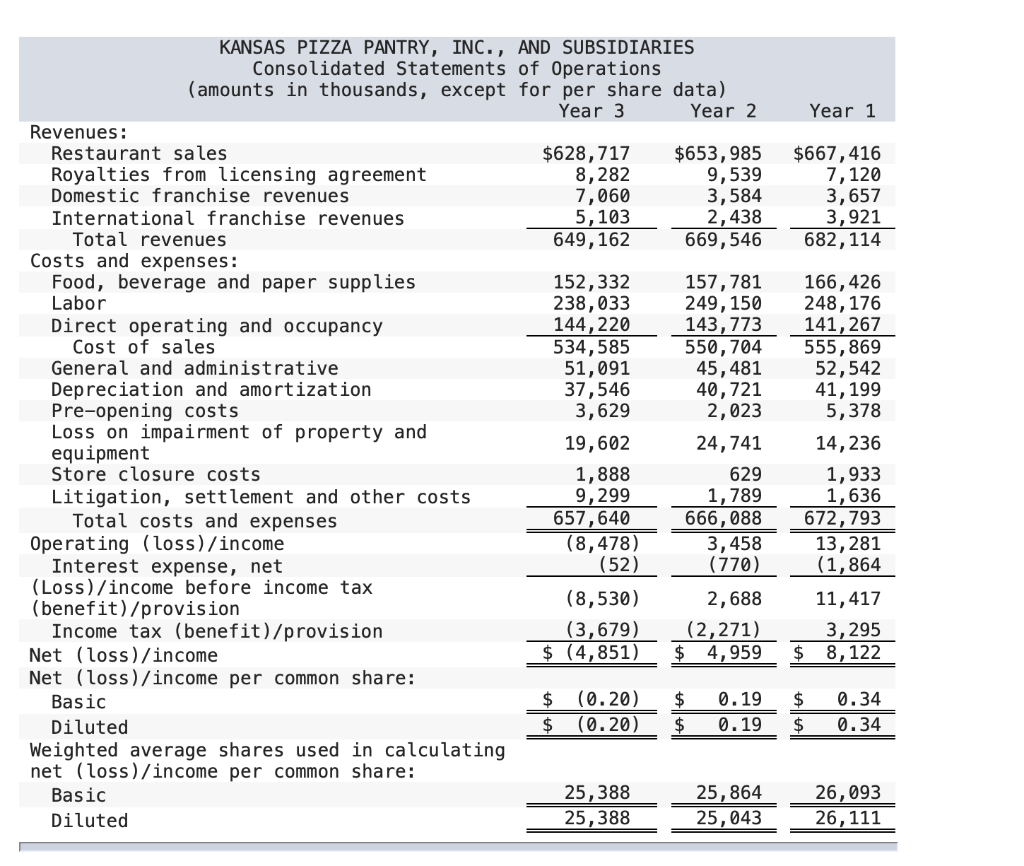
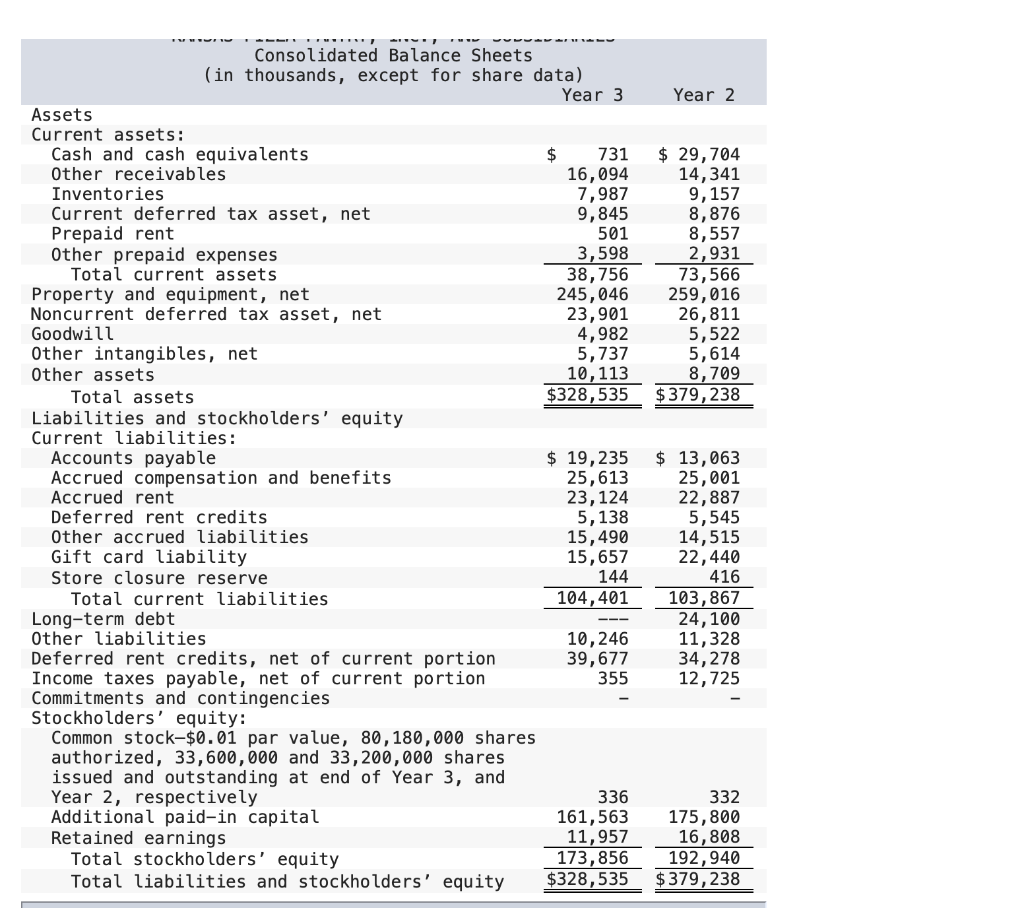
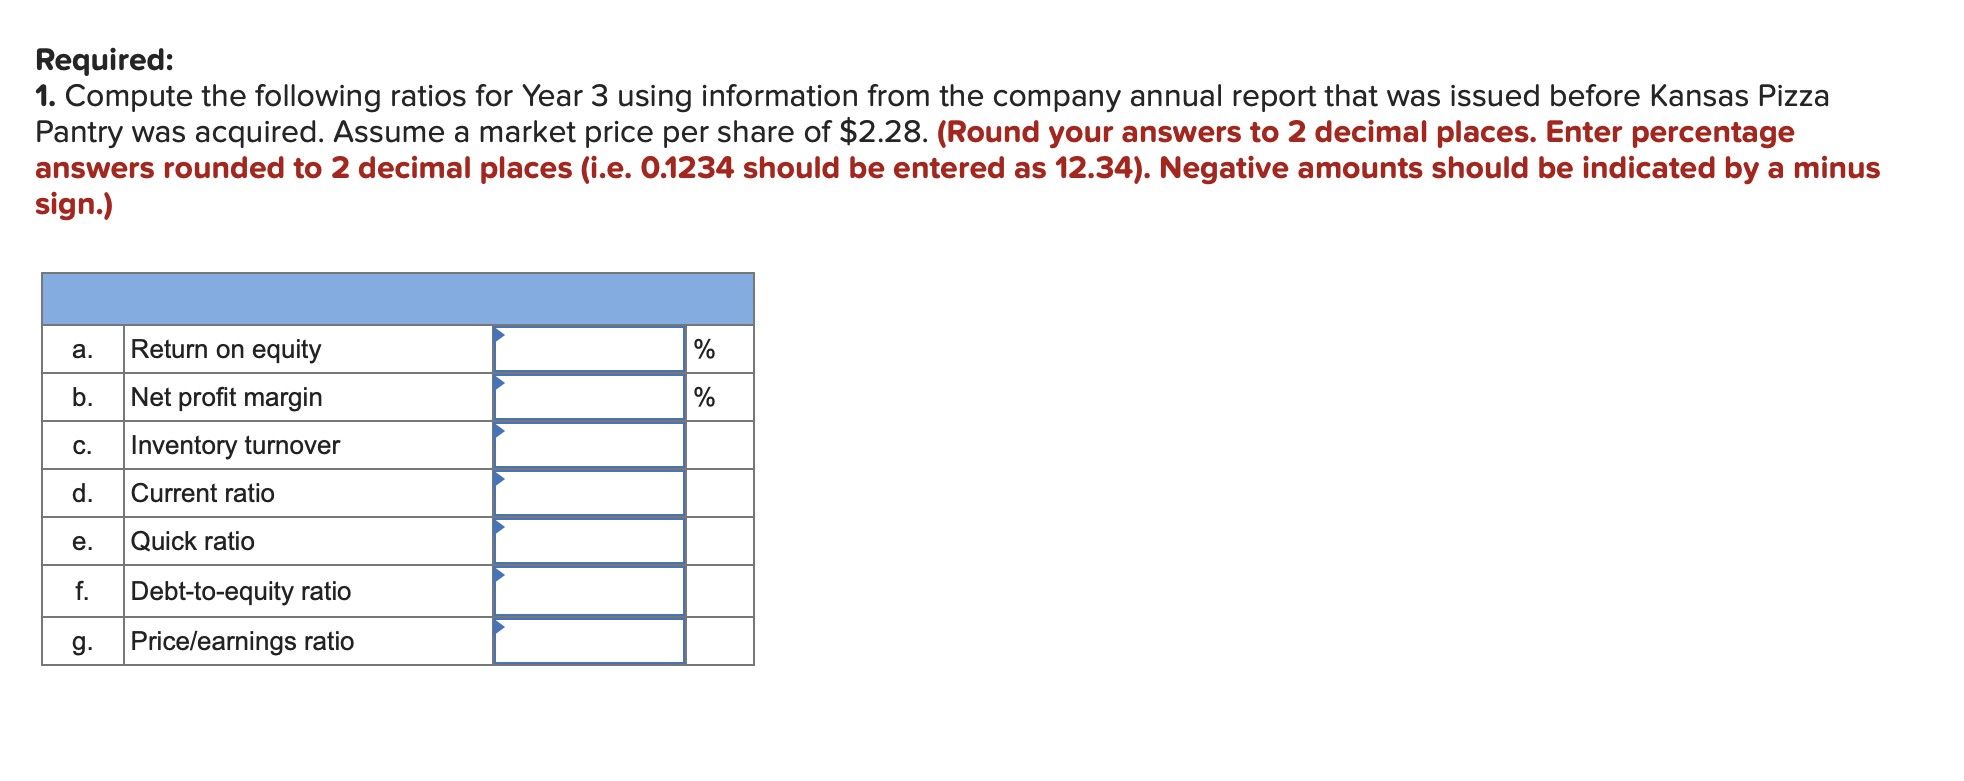
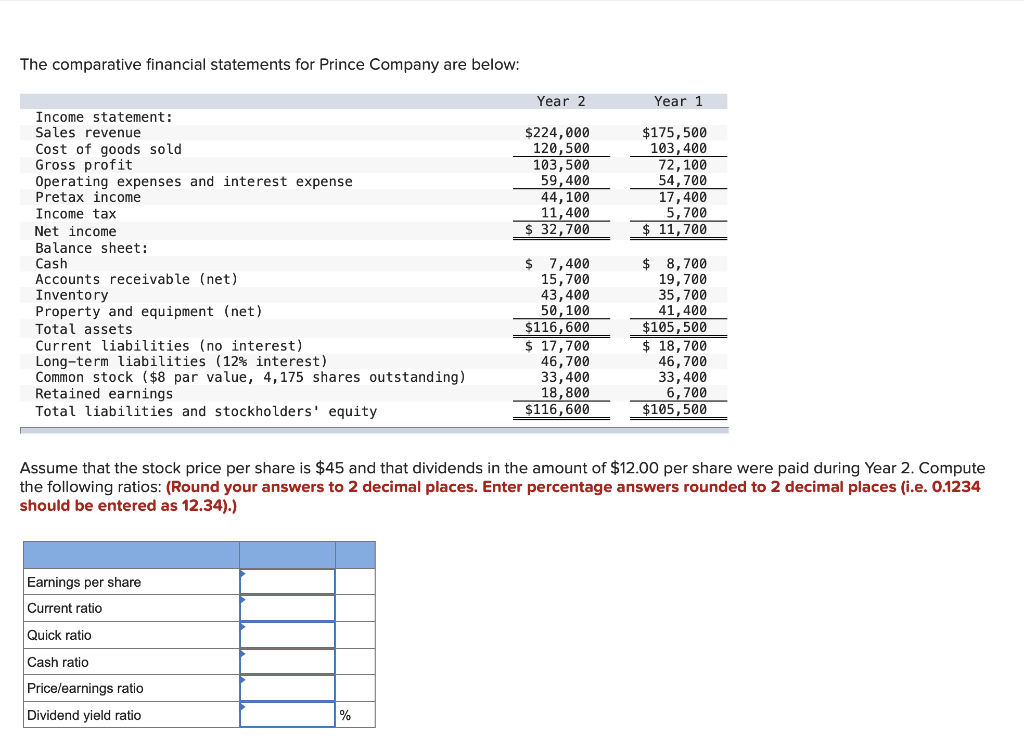
Year 1 $667, 416 7, 120 3,657 3,921 682, 114 KANSAS PIZZA PANTRY, INC., AND SUBSIDIARIES Consolidated Statements of Operations (amounts in thousands, except for per share data) Year 3 Year 2 Revenues: Restaurant sales $628,717 $653,985 Royalties from licensing agreement 8,282 9,539 Domestic franchise revenues 7,060 3,584 International franchise revenues 5,103 2,438 Total revenues 649,162 669,546 Costs and expenses: Food, beverage and paper supplies 152,332 157, 781 Labor 238,033 249, 150 Direct operating and occupancy 144, 220 143, 773 Cost of sales 534,585 550, 704 General and administrative 51,091 45,481 Depreciation and amortization 37,546 40,721 Pre-opening costs 3,629 2,023 Loss on impairment of property and equipment 19,602 24,741 Store closure costs 1,888 629 Litigation, settlement and other costs 9,299 1,789 Total costs and expenses 657,640 666,088 Operating (loss)/income (8,478) 3,458 Interest expense, net (52) (770) (Loss)/income before income tax (benefit)/provision (8,530) 2,688 Income tax (benefit)/provision (3,679) (2,271) Net (loss)/income $ (4,851) $ 4,959 Net (loss)/income per common share: Basic $ (0.20) $ 0.19 Diluted $ (0.20) $ 0.19 Weighted average shares used in calculating net (loss)/income per common share: Basic 25,388 25,864 Diluted 25,388 25,043 166,426 248, 176 141,267 555,869 52,542 41,199 5,378 14,236 1,933 1,636 672,793 13, 281 (1,864 11,417 3,295 $ 8, 122 $ $ 0.34 0.34 26,093 26, 111 Year 2 501 3,598 $ 29, 704 14,341 9,157 8,876 8,557 2,931 73,566 259,016 26,811 5,522 5,614 8,709 $379, 238 Consolidated Balance Sheets (in thousands, except for share data) Year 3 Assets Current assets: Cash and cash equivalents $ 731 Other receivables 16,094 Inventories 7,987 Current deferred tax asset, net 9,845 Prepaid rent Other prepaid expenses Total current assets 38,756 Property and equipment, net 245,046 Noncurrent deferred tax asset, net 23,901 Goodwill 4,982 Other intangibles, net 5,737 Other assets 10,113 Total assets $328,535 Liabilities and stockholders' equity Current liabilities: Accounts payable $ 19, 235 Accrued compensation and benefits 25,613 Accrued rent 23, 124 Deferred rent credits 5,138 Other accrued liabilities 15,490 Gift card liability 15,657 Store closure reserve 144 Total current liabilities 104,401 Long-term debt Other liabilities 10,246 Deferred rent credits, net of current portion 39,677 Income taxes payable, net of current portion 355 Commitments and contingencies Stockholders' equity: Common stock-$0.01 par value, 80, 180,000 shares authorized, 33,600,000 and 33,200,000 shares issued and outstanding at end of Year 3, and Year 2, respectively 336 Additional paid-in capital 161,563 Retained earnings 11,957 Total stockholders' equity 173,856 Total liabilities and stockholders' equity $328,535 $ 13,063 25,001 22,887 5,545 14,515 22,440 416 103,867 24,100 11,328 34,278 12,725 332 175,800 16,808 192, 940 $379, 238 Required: 1. Compute the following ratios for Year 3 using information from the company annual report that was issued before Kansas Pizza Pantry was acquired. Assume a market price per share of $2.28. (Round your answers to 2 decimal places. Enter percentage answers rounded to 2 decimal places (i.e. 0.1234 should be entered as 12.34). Negative amounts should be indicated by a minus sign.) a. % b. % . c. d. Return on equity Net profit margin Inventory turnover Current ratio e. Quick ratio f. Debt-to-equity ratio Pricelearnings ratio g. The comparative financial statements for Prince Company are below: Year 2 Year 1 $224,000 120,500 103,500 59,400 44,100 11,400 $ 32,700 $175,500 103,400 72,100 54,700 17,400 5,700 11,700 Income statement : Sales revenue Cost of goods sold Gross profit Operating expenses and interest expense Pretax income Income tax Net income Balance sheet: Cash Accounts receivable (net) Inventory Property and equipment (net) Total assets Current liabilities (no interest) Long-term liabilities (12% interest) Common stock ($8 par value, 4,175 shares outstanding) Retained earnings Total liabilities and stockholders' equity $ 7,400 15,700 43,400 50, 100 $116,600 $ 17,700 46,700 33,400 18,800 $116,600 $ 8,700 19,700 35,700 41,400 $105,500 $ 18,700 46,700 33,400 6,700 $105,500 Assume that the stock price per share is $45 and that dividends in the amount of $12.00 per share were paid during Year 2. Compute the following ratios: (Round your answers to 2 decimal places. Enter percentage answers rounded to 2 decimal places (i.e. 0.1234 should be entered as 12.34).) Earnings per share Current ratio Quick ratio Cash ratio Price/earnings ratio Dividend yield ratio %