

Answered step by step
Verified Expert Solution
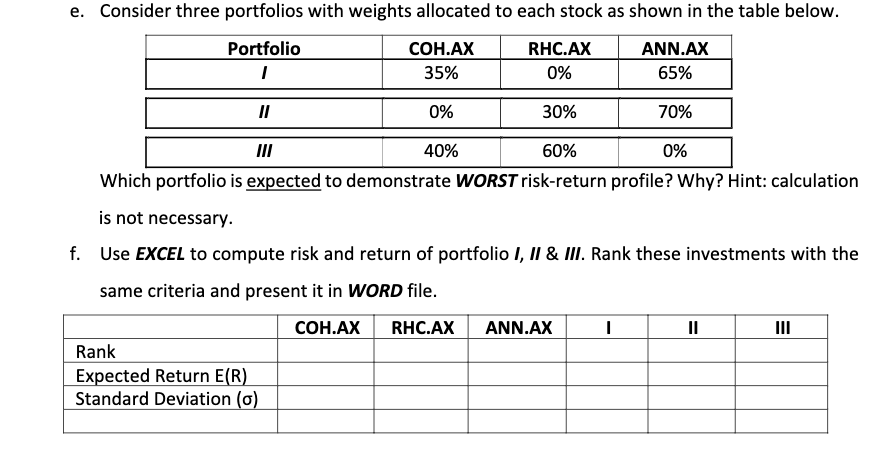
Question
1 Approved Answer
Year COH.AX RHC.AX ANN.AX 2018 173.57 57.73 22.04 2017 171.23 70.12 24.30 2016 122.55 68.30 24.71 2015 95.58 67.94 21.43 2014 77.70 57.10 22.52 2013
| Year | COH.AX | RHC.AX | ANN.AX |
| 2018 | 173.57 | 57.73 | 22.04 |
| 2017 | 171.23 | 70.12 | 24.30 |
| 2016 | 122.55 | 68.30 | 24.71 |
| 2015 | 95.58 | 67.94 | 21.43 |
| 2014 | 77.70 | 57.10 | 22.52 |
| 2013 | 58.92 | 43.26 | 20.67 |
| 2012 | 79.10 | 27.28 | 15.33 |
| 2011 | 62.00 | 19.28 | 14.54 |
| 2010 | 80.41 | 17.80 | 12.68 |
| 2009 | 69.07 | 10.89 | 10.93 |
| 2008 | 55.40 | 10.40 | 12.53 |
| 2007 | 74.90 | 10.95 | 12.07 |
| 2006 | 57.86 | 11.46 | 11.26 |
| 2005 | 45.73 | 9.50 | 11.05 |
| 2004 | 25.25 | 7.12 | 8.93 |
| 2003 | 21.46 | 4.77 | 6.45 |
Step by Step Solution
There are 3 Steps involved in it
Step: 1

Get Instant Access to Expert-Tailored Solutions
See step-by-step solutions with expert insights and AI powered tools for academic success
Step: 2

Step: 3
Ace Your Homework with AI
Get the answers you need in no time with our AI-driven, step-by-step assistance
Get Started
Campaign Finance
Authors: Robert E. Mutch
1st Edition
0190274697, 9780190274696