Answered step by step
Verified Expert Solution
Question
1 Approved Answer
Year Ended December 31, 2016 2017 2018 110,855 136,819 90,272 $ Revenues S Costs and expenses: Cost of revenues 35,138 45,583 59,549 Research and development
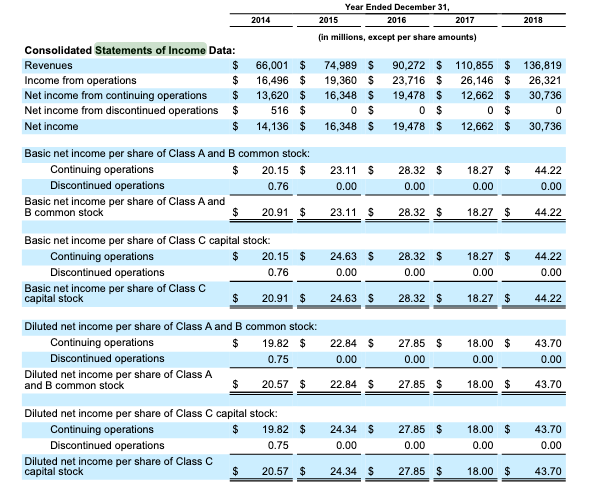
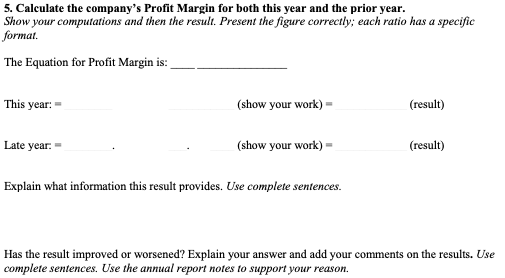
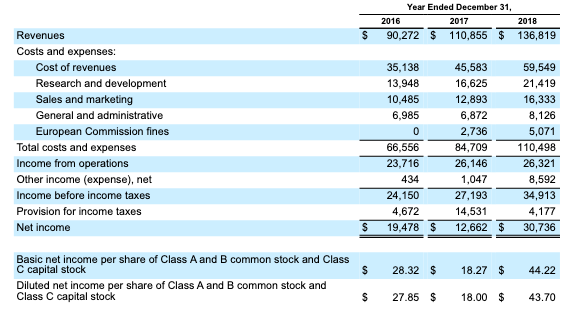
Year Ended December 31, 2016 2017 2018 110,855 136,819 90,272 $ Revenues S Costs and expenses: Cost of revenues 35,138 45,583 59,549 Research and development 13,948 16,625 21,419 Sales and marketing 10,485 12,893 16,333 8,126 General and administrative 6,985 6,872 European Commission fines Total costs and expenses 0 2,736 5,071 66,556 84,709 110,498 Income from operations Other income (expense), net Income before income taxes 23,716 26,146 26,321 8,592 434 1,047 27,193 24,150 34,913 Provision for income taxes 4,672 14,531 4,177 12,662 $ 30,736 19,478 $ Net income S Basic net income per share of Class A and B common stock and Class C capital stock 44.22 S 28.32 $ 18.27 $ Diluted net income per share of Class A and B common stock and Class C capital stock 27.85 S 18.00 $ 43.70 5. Calculate the company's Profit Margin for both this year and the prior year Show your computations and then the result. Present the figure correctly; each ratio has a specific format The Equation for Profit Margin is: This year (show your work) (result) Late year (show your work) (result) Explain what information this result provides. Use complete sentences. Has the result improved or worsened? Explain your answer and add your comments on the results. Use complete sentences. Use the annual report notes to support your reason
Step by Step Solution
There are 3 Steps involved in it
Step: 1
Get Instant Access to Expert-Tailored Solutions
See step-by-step solutions with expert insights and AI powered tools for academic success
Step: 2
Step: 3
Ace Your Homework with AI
Get the answers you need in no time with our AI-driven, step-by-step assistance
Get Started