Year Years since 1800 Population in billions 1804 4 1 1850 50 12 1900 100 1.6 1930 130 2 1950 150 255 1960 160 3
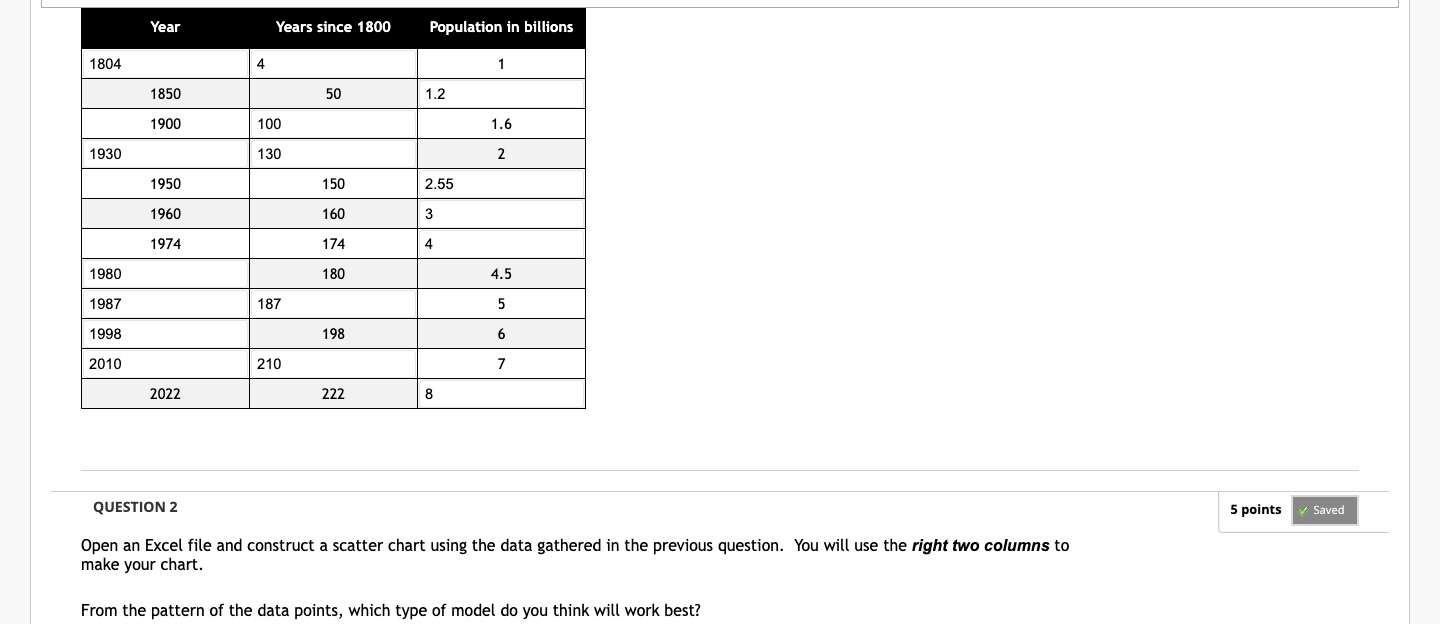
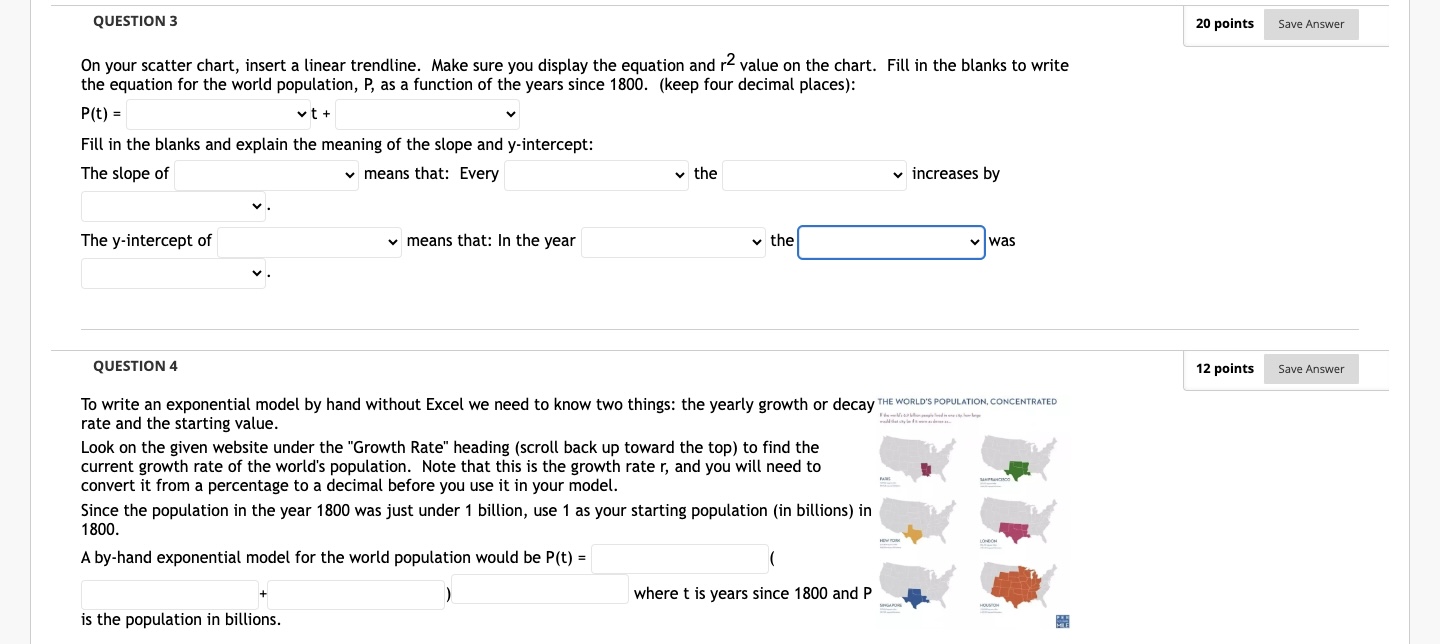
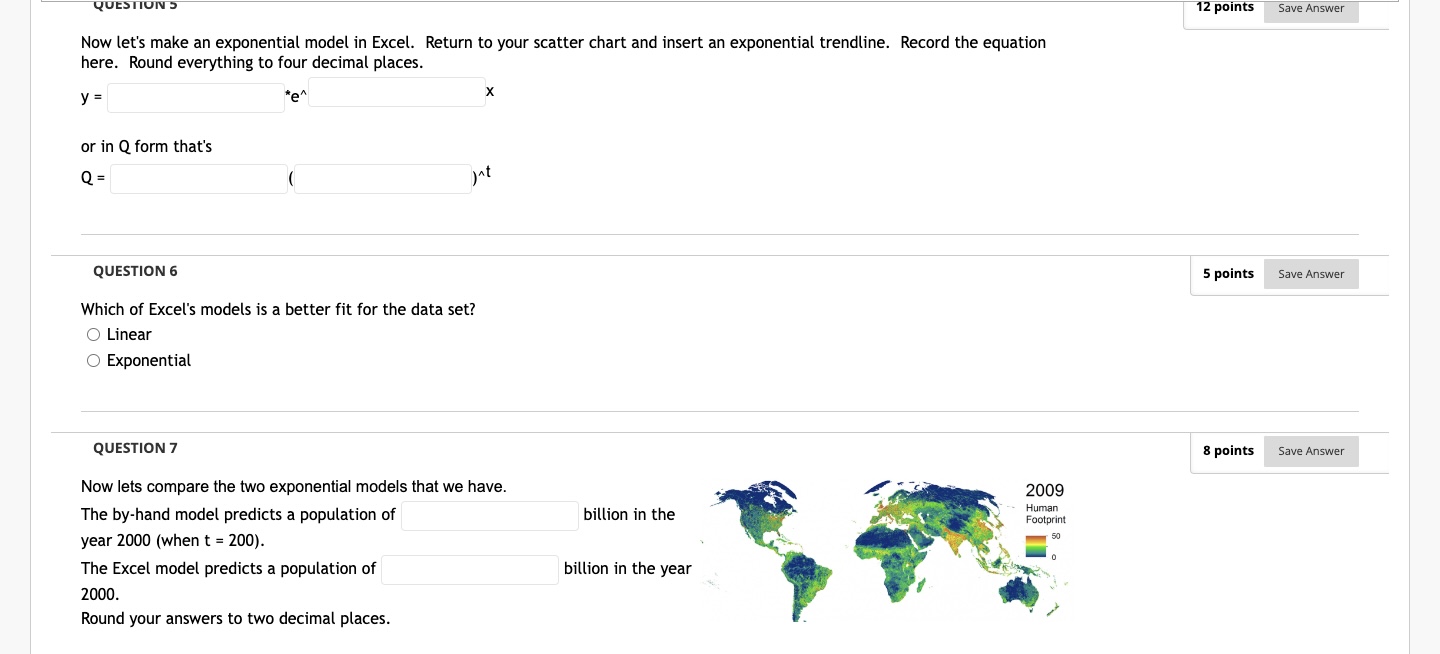
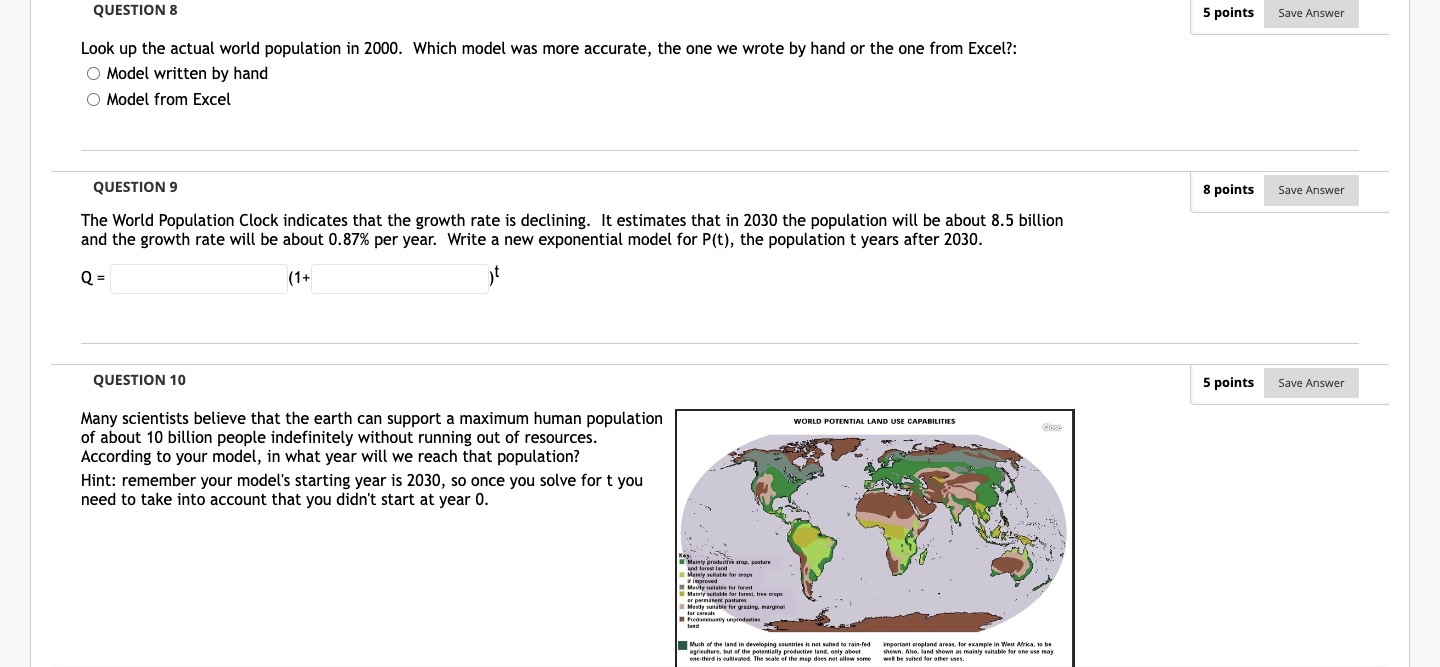
Year Years since 1800 Population in billions 1804 4 1 1850 50 12 1900 100 1.6 1930 130 2 1950 150 255 1960 160 3 1974 174 4 1980 180 4.5 1987 187 5 1990 193 6 2010 210 7 2022 122 8 QUESTION 2 Open an Excel file and construct a scatter chart using the data gathered in the previous question. You will use the right two columns to make your chart. From the pattern of the data points, which type of model do you think wi ll work best? 5 points QUESTION 3 On your scatter chart, insert a linear trendline. Make sure you display the equation and r2 value on the chart. Fill in the blanks to write the equation for the world population, P, as a function of the years since 1300. (keep four decimal places]: pm = Vt + v Fill in the blanks and explain the meaning of the slope and y-intercept: The slope of v means that: Every v the v increases by V . The y-intercept of v means that: In the year v thewas V . QUESTION 4 To write an exponential model by hand without Excel we need to know two things: the yearly growth or decay\" \"'5'\" \""1" \"""ON \"\"'-'"\"'\"\"'' rate and the starting value. Look on the given website under the "Growth Rate" heading [scroll back up toward the top) to [ind the current growth rate of the world's population. Note that this is the growth rate r, and you will need to - convert it from a percentage to a decimal before you use it in your model. ' Since the population in the year 1800 was just under 1 billion, use 1 as your starting population (in billions) in .. .'I 1800. H' + ] where t is years since 1800 and P *,_ i E! A by-hand exponential model for the world population would be P(t) = { is the population in billions. 2|] points 12 points Save Answer Save Answer QUESTION S 12 points Save Answer Now let's make an exponential model in Excel. Return to your scatter chart and insert an exponential trendline. Record the equation here. Round everything to four decimal places. y = X or in Q form that's Q = QUESTION 6 5 points Save Answer Which of Excel's models is a better fit for the data set? O Linear O Exponential QUESTION 7 8 points Save Answer Now lets compare the two exponential models that we have. 2009 The by-hand model predicts a population of billion in the Human Footprint year 2000 (when t = 200). 50 The Excel model predicts a population of billion in the year 2000. Round your answers to two decimal places.QUESTION 8 5 points Save Answer Look up the actual world population in 2000. Which model was more accurate, the one we wrote by hand or the one from Excel?: O Model written by hand O Model from Excel QUESTION 9 8 points Save Answer The World Population Clock indicates that the growth rate is declining. It estimates that in 2030 the population will be about 8.5 billion and the growth rate will be about 0.87% per year. Write a new exponential model for P(t), the population t years after 2030. Q = (1+ QUESTION 10 5 points Save Answer Many scientists believe that the earth can support a maximum human population WORLD POTENTIAL LAND USE CAPABILITIES of about 10 billion people indefinitely without running out of resources. According to your model, in what year will we reach that population? Hint: remember your model's starting year is 2030, so once you solve for t you need to take into account that you didn't start at year 0. Mainly productrea crop, puntare Mainly suitable bot maps Movily Helable fer foroil or permanent pauunm. Madly tilable ler grazing, marginal Ficdominantly improdantics Much of the land in developing countries is not suited to rain-fed important cropland areas, for example in West Arka, is be agriculture. ban of the potentially productive land. only Aho. Land sho one third is cultivated. The scale of the map does e map does not allow some well be sailed for atheQUESTION 11 7 points Save Answer Summarize what you learned about the world population from this activity. Write a brief, well-written paragraph discussing world population, exponential growth, carrying capacity, or any other topics in this activity that are of interest to you. You may want to do additional research. For the toolbar, press ALT+F10 (PC) or ALT+FN+F10 (Mac) BIUS Paragraph Arial 10pt A Ix . .. E E x2 X2 IT The X EX: ( ; ) O + P 0 WORDS POWERED BY TINY
Step by Step Solution
There are 3 Steps involved in it
Step: 1
Get Instant Access to Expert-Tailored Solutions
See step-by-step solutions with expert insights and AI powered tools for academic success
Step: 2
Step: 3
Ace Your Homework with AI
Get the answers you need in no time with our AI-driven, step-by-step assistance