Question
Yo u have been tasked to analysis the HMF content in a number of different honey samples. The following is the method which was carried
Yo u have been tasked to analysis the HMF content in a number of different honey samples. The following is the method which was carried out:
The HPLC system was made up of a Waters 717 plus autosampler, a Waters 600 pump, a Waters column heater module and a Waters 996 photodiode array detector managed by Empower software (Waters Inc., Milford, MA). The stationary phase was a Symmetry C18 analytical column (250 4.6 mm i.d.) with a particle size of 5 m (Woodford, Santry, Dublin). Mobile phases for elution consisted of previously degassed ultra-filtered water : acetic acid (99: 1, v/v) (A) and methanol (B) at a constant flow rate of 0.7 mL/min. The column temperature was set to 30C whilst the sample chamber was set to 10 C to prevent degradation of HMF. The injection volume was 20 L and the chromatograms were monitored at 285 nm. A gradient elution programme was applied to first elute HMF and then switch to a less polar solvent composition to elute any remaining honey components and prevent column contamination. The gradient elution is provided in the table below:


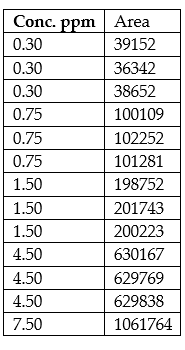
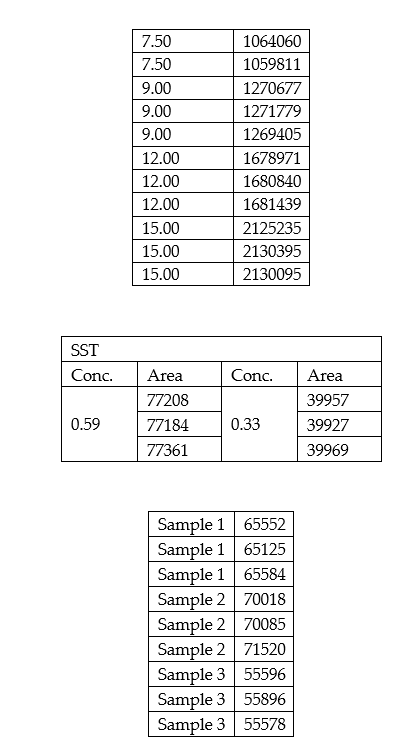
Determine the average and the standard deviation HMF content for each of the 3 different honey samples labelled.
Apply linear regression analysis and determine LOQ and LOD for the method under investigation. Please provide the software out and the workings
Determine the % RSD for the system suitability and suggest whether system is stable or not.
Suggest ways how we can determine the robustness and ruggedness of this method.
\begin{tabular}{c|cc} Time (min) & \% Solvent A & \% Solvent B \\ \hline 015 & 90 & 10 \\ 1525 & 10 & 90 \\ 2530 & 90 & 10 \end{tabular} \begin{tabular}{|l|l|} \hline Conc. ppm & Area \\ \hline 0.30 & 39152 \\ \hline 0.30 & 36342 \\ \hline 0.30 & 38652 \\ \hline 0.75 & 100109 \\ \hline 0.75 & 102252 \\ \hline 0.75 & 101281 \\ \hline 1.50 & 198752 \\ \hline 1.50 & 201743 \\ \hline 1.50 & 200223 \\ \hline 4.50 & 630167 \\ \hline 4.50 & 629769 \\ \hline 4.50 & 629838 \\ \hline 7.50 & 1061764 \\ \hline \end{tabular} \begin{tabular}{|l|l|} \hline 7.50 & 1064060 \\ \hline 7.50 & 1059811 \\ \hline 9.00 & 1270677 \\ \hline 9.00 & 1271779 \\ \hline 9.00 & 1269405 \\ \hline 12.00 & 1678971 \\ \hline 12.00 & 1680840 \\ \hline 12.00 & 1681439 \\ \hline 15.00 & 2125235 \\ \hline 15.00 & 2130395 \\ \hline 15.00 & 2130095 \\ \hline \end{tabular} \begin{tabular}{|l|l|l|l|} \hline \multicolumn{2}{|l|}{ SST } \\ \hline Conc. & Area & Conc. & Area \\ \hline \multirow{4}{*}{0.59} & 77208 & \multirow{4}{*}{0.33} & 39957 \\ \cline { 2 - 2 } & 77184 & & 39927 \\ \cline { 2 - 2 } & 77361 & & 39969 \\ \hline \end{tabular} \begin{tabular}{|c|c|} \hline Sample 1 & 65552 \\ \hline Sample 1 & 65125 \\ \hline Sample 1 & 65584 \\ \hline Sample 2 & 70018 \\ \hline Sample 2 & 70085 \\ \hline Sample 2 & 71520 \\ \hline Sample 3 & 55596 \\ \hline Sample 3 & 55896 \\ \hline Sample 3 & 55578 \\ \hline \end{tabular}Step by Step Solution
There are 3 Steps involved in it
Step: 1

Get Instant Access to Expert-Tailored Solutions
See step-by-step solutions with expert insights and AI powered tools for academic success
Step: 2

Step: 3

Ace Your Homework with AI
Get the answers you need in no time with our AI-driven, step-by-step assistance
Get Started


