

Question
You are a financial analyst in the Bridgetown Foundationa public service agency in Chicago that provides specialized mental care services to the poor. The foundations
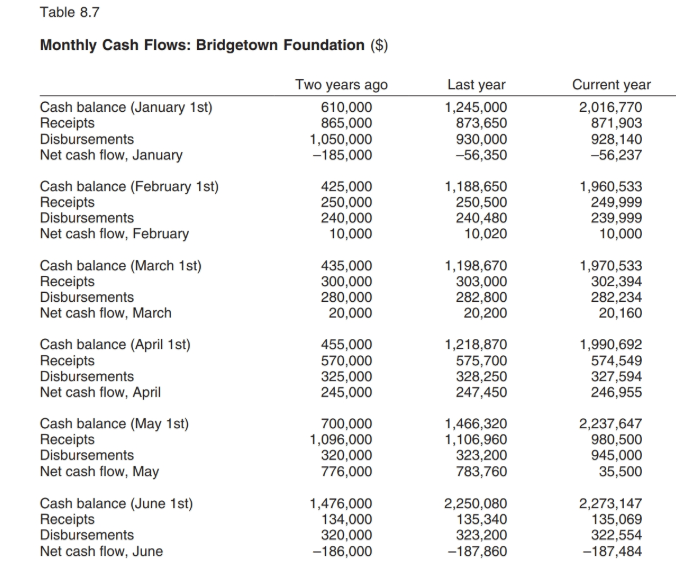
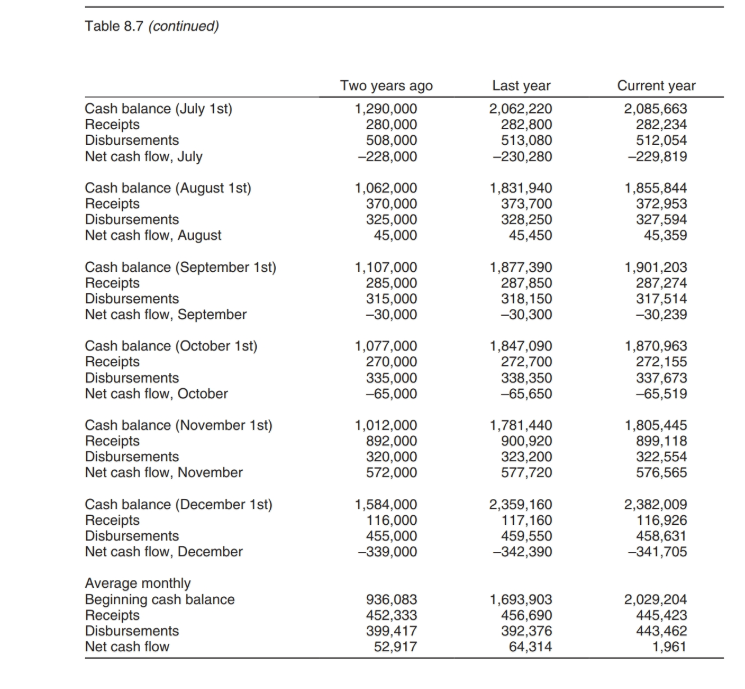
You are a financial analyst in the Bridgetown Foundationa public service agency in Chicago that provides specialized mental care services to the poor. The foundations financial resources are mainly from various state and federal grants and business or individual donations. In a recent financial audit, an independent auditor suggested the foundation explore the possibility of investing in the market as an additional revenue source. You are assigned the responsibility of analyzing the foundations cash flows to determine whether such a possibility exists and, if it does, how much the founda- tion should invest and what the investment strategy should be. You pull out the cash flow information for the last three years as shown in Table 8.7.
1. Create a cash budget forth next year. Use the proper forecasting techniques (from Chapter 1) and defend your reasoning for your choice of technique. (Use SMA (i.e., average the three provided years) as the forecasting technique in question #1.)
2. Assuming a lower limit of $1,000,000, a transaction fee of $200, and a 5 percent annual interest rate, use the Miller-Orr model to determine the upper limit and the return point of the cash balance.
3. Do you see any investment opportunities for the foundations cash? If yes, develop an investment strategy for the foundation. Use the cash balance and the Miller-Orr Model to make a recommendation that states either: 1) how much cash should be invested, 2) no action is necessary, or 3) how much cash is needed for replenishment.
Table 8.7 Monthly Cash Flows: Bridgetown Foundation ($) Last year Current year Two years ago Cash balance (January 1st) Receipts Disbursements Net cash flow, January 610,000 865,000 1,050,000 -185,000 1,245,000 873,650 930,000 -56,350 2,016,770 871,903 928,140 -56,237 Cash balance (February 1st) Receipts Disbursements 425,000 250,000 240,000 10,000 1,188,650 250,500 240,480 10,020 1,960,533 249,999 239,999 10,000 Net cash flow, February Cash balance (March 1st) Receipts Disbursements Net cash flow, March 435,000 300,000 280,000 20,000 1,198,670 303,000 282,800 20,200 1,970,533 302,394 282,234 20,160 Cash balance (April 1st) Receipts Disbursements Net cash flow, April 455,000 570,000 325,000 245,000 1,218,870 575,700 328,250 247,450 1,990,692 574,549 327,594 246,955 Cash balance (May 1st) Receipts Disbursements 700,000 1,096,000 320,000 776,000 1,466,320 1,106,960 323,200 783,760 2,237,647 980,500 945,000 35,500 Net cash flow, May Cash balance (June 1st) Receipts Disbursements Net cash flow, June 2,250,080 135,340 323,200 -187,860 2,273,147 135,069 322,554 -187,484 1,476,000 134,000 320,000 -186,000 Table 8.7 (continued) Two years ago Current year Last year Cash balance (July 1st) Receipts Disbursements 1,290,000 280,000 508,000 -228,000 2,062,220 282,800 513,080 -230,280 2,085,663 282,234 512,054 -229,819 Net cash flow, July Cash balance (August 1st) Receipts Disbursements Net cash flow, August 1,062,000 370,000 325,000 45,000 1,831,940 373,700 328,250 45,450 1,855,844 372,953 327,594 45,359 Cash balance (September 1st) Receipts Disbursements Net cash flow, September 1,107,000 285,000 315,000 30,000 1,877,390 287,850 318,150 -30,300 1,901,203 287,274 317,514 -30,239 Cash balance (October 1st) Receipts Disbursements 1,077,000 270,000 335,000 -65,000 1,847,090 272,700 338,350 -65,650 1,870,963 272,155 337,673 -65,519 Net cash flow, October Cash balance (November 1st) Receipts Disbursements Net cash flow, November 1,805,445 899,118 322,554 576,565 1,012,000 892,000 320,000 572,000 1,781,440 900,920 323,200 577,720 Cash balance (December 1st) Receipts Disbursements Net cash flow, December 1,584,000 116,000 455,000 -339,000 2,359,160 117,160 459,550 -342,390 2,382,009 116,926 458,631 -341,705 Average monthly Beginning cash balance Receipts Disbursements 2,029,204 445,423 443,462 1,961 936,083 452,333 399,417 52,917 1,693,903 456,690 392,376 64,314 Net cash flow Table 8.7 Monthly Cash Flows: Bridgetown Foundation ($) Last year Current year Two years ago Cash balance (January 1st) Receipts Disbursements Net cash flow, January 610,000 865,000 1,050,000 -185,000 1,245,000 873,650 930,000 -56,350 2,016,770 871,903 928,140 -56,237 Cash balance (February 1st) Receipts Disbursements 425,000 250,000 240,000 10,000 1,188,650 250,500 240,480 10,020 1,960,533 249,999 239,999 10,000 Net cash flow, February Cash balance (March 1st) Receipts Disbursements Net cash flow, March 435,000 300,000 280,000 20,000 1,198,670 303,000 282,800 20,200 1,970,533 302,394 282,234 20,160 Cash balance (April 1st) Receipts Disbursements Net cash flow, April 455,000 570,000 325,000 245,000 1,218,870 575,700 328,250 247,450 1,990,692 574,549 327,594 246,955 Cash balance (May 1st) Receipts Disbursements 700,000 1,096,000 320,000 776,000 1,466,320 1,106,960 323,200 783,760 2,237,647 980,500 945,000 35,500 Net cash flow, May Cash balance (June 1st) Receipts Disbursements Net cash flow, June 2,250,080 135,340 323,200 -187,860 2,273,147 135,069 322,554 -187,484 1,476,000 134,000 320,000 -186,000 Table 8.7 (continued) Two years ago Current year Last year Cash balance (July 1st) Receipts Disbursements 1,290,000 280,000 508,000 -228,000 2,062,220 282,800 513,080 -230,280 2,085,663 282,234 512,054 -229,819 Net cash flow, July Cash balance (August 1st) Receipts Disbursements Net cash flow, August 1,062,000 370,000 325,000 45,000 1,831,940 373,700 328,250 45,450 1,855,844 372,953 327,594 45,359 Cash balance (September 1st) Receipts Disbursements Net cash flow, September 1,107,000 285,000 315,000 30,000 1,877,390 287,850 318,150 -30,300 1,901,203 287,274 317,514 -30,239 Cash balance (October 1st) Receipts Disbursements 1,077,000 270,000 335,000 -65,000 1,847,090 272,700 338,350 -65,650 1,870,963 272,155 337,673 -65,519 Net cash flow, October Cash balance (November 1st) Receipts Disbursements Net cash flow, November 1,805,445 899,118 322,554 576,565 1,012,000 892,000 320,000 572,000 1,781,440 900,920 323,200 577,720 Cash balance (December 1st) Receipts Disbursements Net cash flow, December 1,584,000 116,000 455,000 -339,000 2,359,160 117,160 459,550 -342,390 2,382,009 116,926 458,631 -341,705 Average monthly Beginning cash balance Receipts Disbursements 2,029,204 445,423 443,462 1,961 936,083 452,333 399,417 52,917 1,693,903 456,690 392,376 64,314 Net cash flowStep by Step Solution
There are 3 Steps involved in it
Step: 1

Get Instant Access to Expert-Tailored Solutions
See step-by-step solutions with expert insights and AI powered tools for academic success
Step: 2

Step: 3
Ace Your Homework with AI
Get the answers you need in no time with our AI-driven, step-by-step assistance
Get Started
Systems Direct Auditing Practice Case IBM Book Workbook And 5.25 Disk
Authors: Dieter Weiss, Gaylord N. Smith
1st Edition
0538809051, 978-0538809054