Answered step by step
Verified Expert Solution
Question
1 Approved Answer
You are a financial analyst working for a reputable investment firm, tasked with evaluating the risk and return characteristics of a specific stock (Pick a
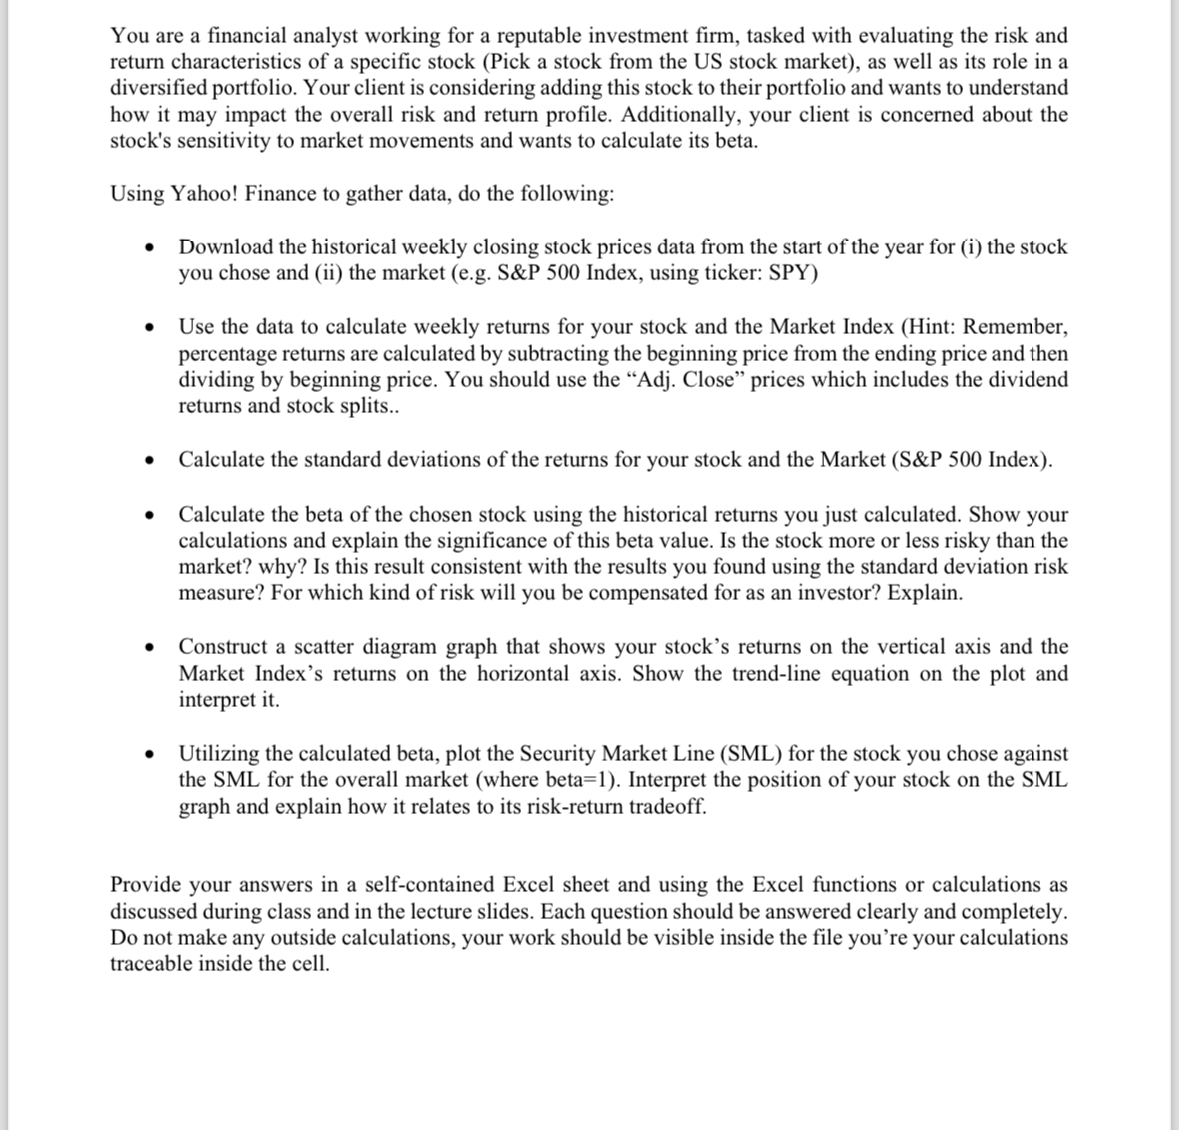
 You are a financial analyst working for a reputable investment firm, tasked with evaluating the risk and return characteristics of a specific stock (Pick a stock from the US stock market), as well as its role in a diversified portfolio. Your client is considering adding this stock to their portfolio and wants to understand how it may impact the overall risk and return profile. Additionally, your client is concerned about the stock's sensitivity to market movements and wants to calculate its beta. Using Yahoo! Finance to gather data, do the following: - Download the historical weekly closing stock prices data from the start of the year for (i) the stock you chose and (ii) the market (e.g. S\&P 500 Index, using ticker: SPY) - Use the data to calculate weekly returns for your stock and the Market Index (Hint: Remember, percentage returns are calculated by subtracting the beginning price from the ending price and then dividing by beginning price. You should use the "Adj. Close" prices which includes the dividend returns and stock splits.. - Calculate the standard deviations of the returns for your stock and the Market (S\&P 500 Index). - Calculate the beta of the chosen stock using the historical returns you just calculated. Show your calculations and explain the significance of this beta value. Is the stock more or less risky than the market? why? Is this result consistent with the results you found using the standard deviation risk measure? For which kind of risk will you be compensated for as an investor? Explain. - Construct a scatter diagram graph that shows your stock's returns on the vertical axis and the Market Index's returns on the horizontal axis. Show the trend-line equation on the plot and interpret it. - Utilizing the calculated beta, plot the Security Market Line (SML) for the stock you chose against the SML for the overall market (where beta=1). Interpret the position of your stock on the SML graph and explain how it relates to its risk-return tradeoff. Provide your answers in a self-contained Excel sheet and using the Excel functions or calculations as discussed during class and in the lecture slides. Each question should be answered clearly and completely. Do not make any outside calculations, your work should be visible inside the file you're your calculations traceable inside the cell
 Step by Step Solution
There are 3 Steps involved in it
Step: 1

Get Instant Access to Expert-Tailored Solutions
See step-by-step solutions with expert insights and AI powered tools for academic success
Step: 2

Step: 3

Ace Your Homework with AI
Get the answers you need in no time with our AI-driven, step-by-step assistance
Get Started


