

Question
You are analyzing the financial data of Linda Company to understand the risk of the firm. Refer to Linda Company' summary financial statement data for
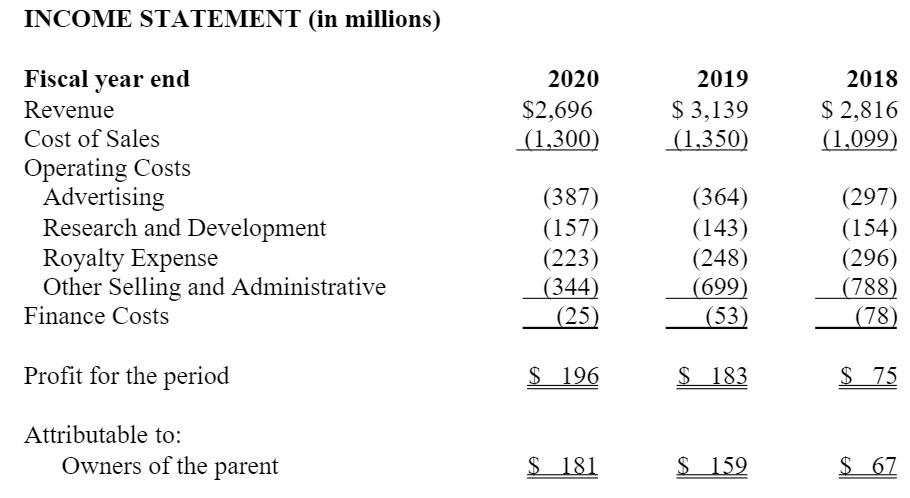
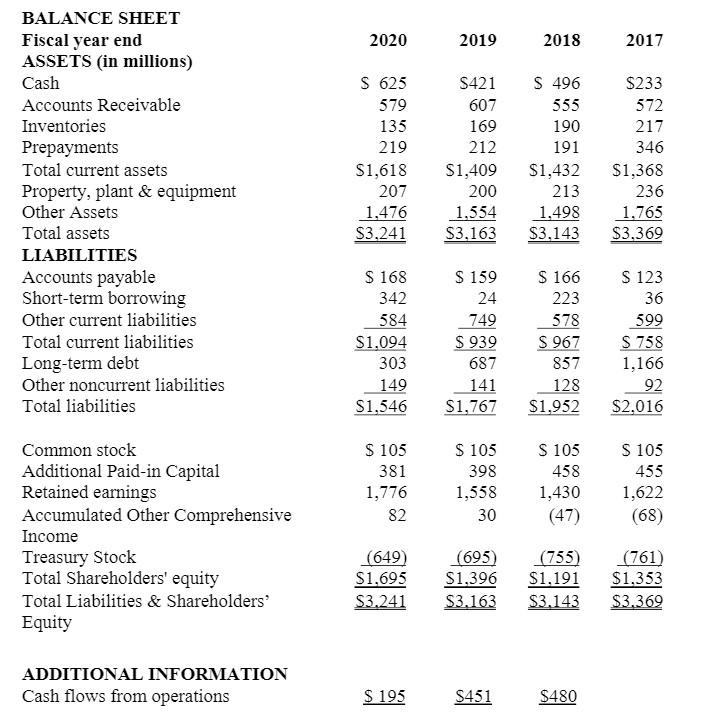
You are analyzing the financial data of Linda Company to understand the risk of the firm. Refer to Linda Company' summary financial statement data for the years 2018-2020.
A. Flowing ratios related to Linda Company's profitability are presented below for 2019 and 2018. Assume the tax rate is 15%. Calculate the ratios for 2020.
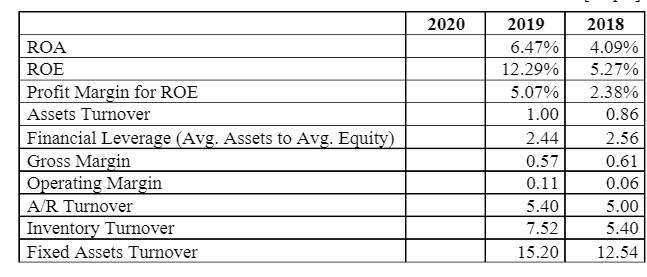
B. Based on the three-years data and comparisons of the ratios above, comment on ROE of Linda Company from DuPont analysis perspective.
C. Based on the inventory turnover ratio and gross margin calculated above, discusspossible economic situations and Linda's business strategies.
D. Flowing ratios related to Linda Company's risk are presented in the below for 2019and 2018. Calculate risk ratios for 2020.
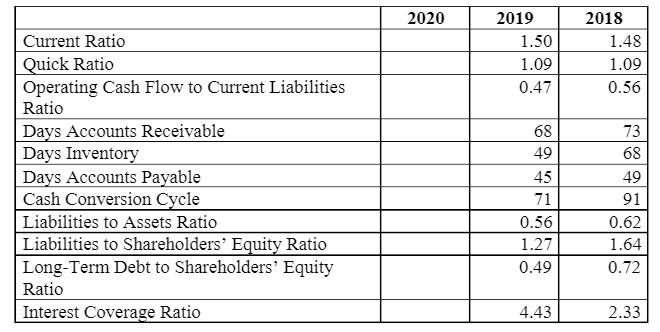
E. Assess the short-term liquidity risk and long-term solvency risk of Linda Company using ratios from 2018 to 2020.
F. Give recommendations to deal with the financial risk of Linda Company.
INCOME STATEMENT (in millions) Attributable to: Owners of the parent $159$181 $67 BALANCE SHEET ADDITIONAL INFORMATION Cash flows from operations $195$451$480 \begin{tabular}{|l|r|r|r|} \hline & 2020 & \multicolumn{1}{|c|}{2019} & \multicolumn{1}{c|}{2018} \\ \hline ROA & & 6.47% & 4.09% \\ \hline ROE & & 12.29% & 5.27% \\ \hline Profit Margin for ROE & & 5.07% & 2.38% \\ \hline Assets Turnover & & 1.00 & 0.86 \\ \hline Financial Leverage (Avg. Assets to Avg. Equity) & & 2.44 & 2.56 \\ \hline Gross Margin & & 0.57 & 0.61 \\ \hline Operating Margin & & 0.11 & 0.06 \\ \hline A/R Turnover & & 5.40 & 5.00 \\ \hline Inventory Turnover & & 7.52 & 5.40 \\ \hline Fixed Assets Turnover & & 15.20 & 12.54 \\ \hline \end{tabular} \begin{tabular}{|l|r|r|r|} \hline & 2020 & \multicolumn{1}{|c|}{2019} & \multicolumn{1}{c|}{2018} \\ \hline Current Ratio & & 1.50 & 1.48 \\ \hline Quick Ratio & & 1.09 & 1.09 \\ \hline Operating Cash Flow to Current Liabilities Ratio & & 0.47 & 0.56 \\ \hline Days Accounts Receivable & & 68 & 73 \\ \hline Days Inventory & & 49 & 68 \\ \hline Days Accounts Payable & & 45 & 49 \\ \hline Cash Conversion Cycle & 71 & 91 \\ \hline Liabilities to Assets Ratio & & 0.56 & 0.62 \\ \hline Liabilities to Shareholders' Equity Ratio & & 1.27 & 1.64 \\ \hline Long-Term Debt to Shareholders' Equity Ratio & & 0.49 & 0.72 \\ \hline Interest Coverage Ratio & & 4.43 & 2.33 \\ \hline \end{tabular} INCOME STATEMENT (in millions) Attributable to: Owners of the parent $159$181 $67 BALANCE SHEET ADDITIONAL INFORMATION Cash flows from operations $195$451$480 \begin{tabular}{|l|r|r|r|} \hline & 2020 & \multicolumn{1}{|c|}{2019} & \multicolumn{1}{c|}{2018} \\ \hline ROA & & 6.47% & 4.09% \\ \hline ROE & & 12.29% & 5.27% \\ \hline Profit Margin for ROE & & 5.07% & 2.38% \\ \hline Assets Turnover & & 1.00 & 0.86 \\ \hline Financial Leverage (Avg. Assets to Avg. Equity) & & 2.44 & 2.56 \\ \hline Gross Margin & & 0.57 & 0.61 \\ \hline Operating Margin & & 0.11 & 0.06 \\ \hline A/R Turnover & & 5.40 & 5.00 \\ \hline Inventory Turnover & & 7.52 & 5.40 \\ \hline Fixed Assets Turnover & & 15.20 & 12.54 \\ \hline \end{tabular} \begin{tabular}{|l|r|r|r|} \hline & 2020 & \multicolumn{1}{|c|}{2019} & \multicolumn{1}{c|}{2018} \\ \hline Current Ratio & & 1.50 & 1.48 \\ \hline Quick Ratio & & 1.09 & 1.09 \\ \hline Operating Cash Flow to Current Liabilities Ratio & & 0.47 & 0.56 \\ \hline Days Accounts Receivable & & 68 & 73 \\ \hline Days Inventory & & 49 & 68 \\ \hline Days Accounts Payable & & 45 & 49 \\ \hline Cash Conversion Cycle & 71 & 91 \\ \hline Liabilities to Assets Ratio & & 0.56 & 0.62 \\ \hline Liabilities to Shareholders' Equity Ratio & & 1.27 & 1.64 \\ \hline Long-Term Debt to Shareholders' Equity Ratio & & 0.49 & 0.72 \\ \hline Interest Coverage Ratio & & 4.43 & 2.33 \\ \hline \end{tabular}Step by Step Solution
There are 3 Steps involved in it
Step: 1

Get Instant Access to Expert-Tailored Solutions
See step-by-step solutions with expert insights and AI powered tools for academic success
Step: 2

Step: 3
Ace Your Homework with AI
Get the answers you need in no time with our AI-driven, step-by-step assistance
Get Started
A Biodiversity Audit For Lotopue Mangrove Forests
Authors: Sapa Saifaleupolu, Fiu Mataese Elisara
1st Edition
6200288674, 978-6200288677