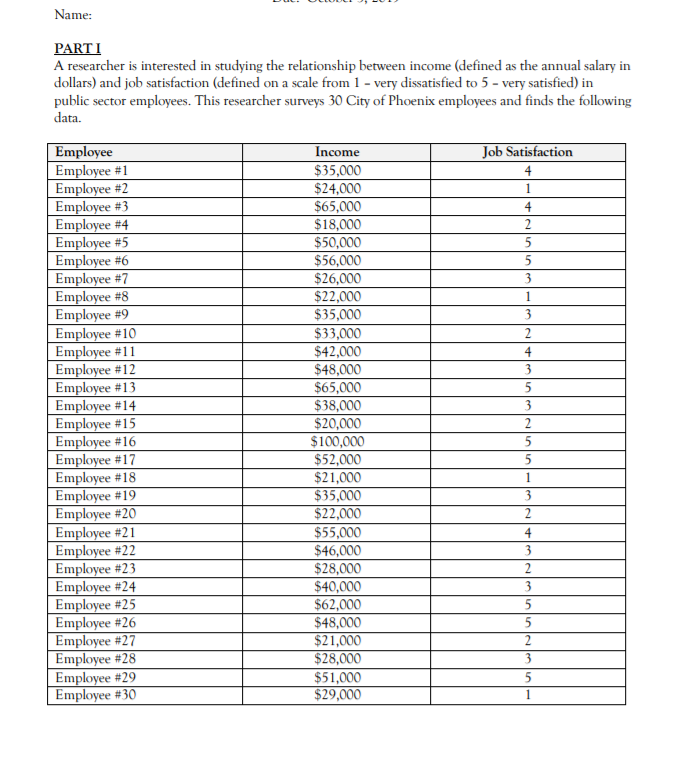
Name: PARTI A researcher is interested in studying the relationship between income (defined as the annual salary in dollars) and job satisfaction (defined on a scale from 1 - very dissatisfied to 5 - very satisfied) in public sector employees. This researcher surveys 30 City of Phoenix employees and finds the following data. Job Satisfaction 1 2 5 3 Employee Employee #1 Employee #2 Employee #3 Employee #4 Employee #5 Employee #6 Employee #7 Employee #8 Employee #9 Employee #10 Employee #11 Employee #12 Employee #13 Employee #14 Employee #15 Employee #16 Employee #17 Employee #18 Employee #19 Employee #20 Employee #21 Employee #22 Employee #23 Employee #24 Employee #25 Employee #26 Employee #27 Employee #28 Employee #29 Employee #30 Income $35,000 $24,000 $65,000 $18,000 $50,000 $56.000 $26,000 $22,000 $35,000 $33,000 $42,000 $48,000 $65,000 $38,000 $20,000 $100,000 $52,000 $21,000 $35,000 $22,000 $55,000 $46,000 $28,000 $40,000 $62,000 $48,000 $21,000 $28,000 $51,000 $29,000 2 4 3 2 5 1. Formulate a hypothesis for the researcher based on the relationship between income and job satisfaction. Complete the cross-tab below using the data from above. The variable job satisfaction has been grouped as: Satisfied (4-5 on scale); Neutral (3 on scale); and Dissatisfied (1-2 on scale). For example: an employee responding with an income of $35,000 and a job satisfaction of 3 will be tabulated in the $30,001 - $45,000/Neutral cell in the table. Once you have tabulated the frequencies for the table, change all frequencies to percentages (1 point). Frequency Job Satisfaction Income $30,001-$45,000 TOTAL $30,000 or less $45,001 or more Dissatisfied Neutral Satisfied TOTAL Percentage Job Satisfaction TOTAL Income $30,001-$45,000 $30,000 or less $45,001 or more Dissatisfied Neutral Satisfied TOTAL 2. In a paragraph, answer the following. Does the data shown in the cross-tab support the researcher's hypothesis? How can you tell? Identify the IV, DV and UA and direction of relationship. What happens to job satisfaction as income increases? Decreases? Be specific in your answer, I want you to mention actual percentages as they appear in the cross-tab. (1.5 points) Name: PARTI A researcher is interested in studying the relationship between income (defined as the annual salary in dollars) and job satisfaction (defined on a scale from 1 - very dissatisfied to 5 - very satisfied) in public sector employees. This researcher surveys 30 City of Phoenix employees and finds the following data. Job Satisfaction 1 2 5 3 Employee Employee #1 Employee #2 Employee #3 Employee #4 Employee #5 Employee #6 Employee #7 Employee #8 Employee #9 Employee #10 Employee #11 Employee #12 Employee #13 Employee #14 Employee #15 Employee #16 Employee #17 Employee #18 Employee #19 Employee #20 Employee #21 Employee #22 Employee #23 Employee #24 Employee #25 Employee #26 Employee #27 Employee #28 Employee #29 Employee #30 Income $35,000 $24,000 $65,000 $18,000 $50,000 $56.000 $26,000 $22,000 $35,000 $33,000 $42,000 $48,000 $65,000 $38,000 $20,000 $100,000 $52,000 $21,000 $35,000 $22,000 $55,000 $46,000 $28,000 $40,000 $62,000 $48,000 $21,000 $28,000 $51,000 $29,000 2 4 3 2 5 1. Formulate a hypothesis for the researcher based on the relationship between income and job satisfaction. Complete the cross-tab below using the data from above. The variable job satisfaction has been grouped as: Satisfied (4-5 on scale); Neutral (3 on scale); and Dissatisfied (1-2 on scale). For example: an employee responding with an income of $35,000 and a job satisfaction of 3 will be tabulated in the $30,001 - $45,000/Neutral cell in the table. Once you have tabulated the frequencies for the table, change all frequencies to percentages (1 point). Frequency Job Satisfaction Income $30,001-$45,000 TOTAL $30,000 or less $45,001 or more Dissatisfied Neutral Satisfied TOTAL Percentage Job Satisfaction TOTAL Income $30,001-$45,000 $30,000 or less $45,001 or more Dissatisfied Neutral Satisfied TOTAL 2. In a paragraph, answer the following. Does the data shown in the cross-tab support the researcher's hypothesis? How can you tell? Identify the IV, DV and UA and direction of relationship. What happens to job satisfaction as income increases? Decreases? Be specific in your answer, I want you to mention actual percentages as they appear in the cross-tab. (1.5 points)