

Question
You are looking to combine stock & bond portfolios. The risk and return data are as follows: Risk-free rate = 3.0% E(rtn) stocks = 10%
You are looking to combine stock & bond portfolios. The risk and return data are as follows:
Risk-free rate = 3.0%
E(rtn) stocks = 10%
Volatility stocks = 15%
E(rtn) bonds = 6%
Volatility bonds = 8%
The correlation between stocks & bonds is 0.25.
a) Complete the Excel table (see below) showing varying proportions of stocks & bonds in 5 percentage point increments. Download table by clicking here When calculating return, risk and Sharpe Ratio, you MUST use absolute cell references for the risk, return and correlation of stocks and bonds, and the risk-free rate. Do NOT hard-code any numbers in your calculations. Upload completed table in Excel: A . C D E Return Risk Sharpe Ratio Stock Allocation 0 % Bond Allocation 100% 95% 90% 5% 10% 15% 85% 20% 25% 30% 35% 80% 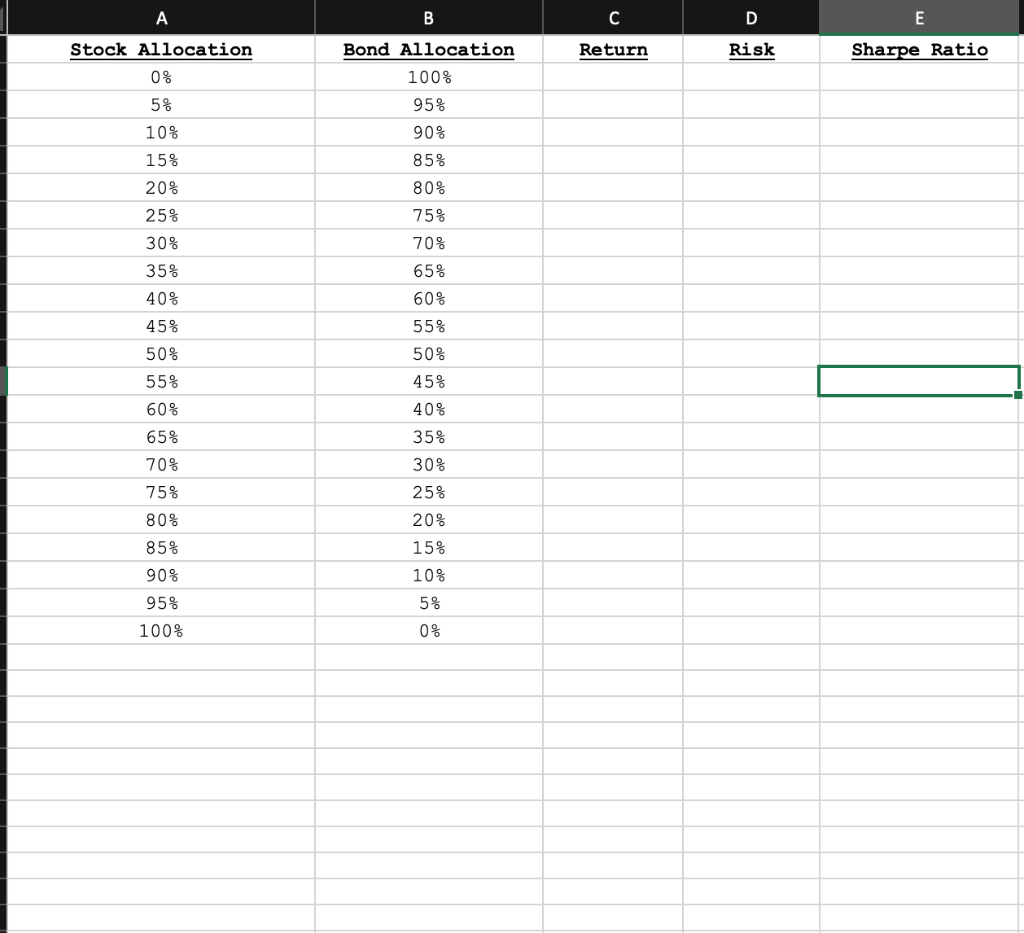
b) What is the optimal risky portfolio (e.g. the optimal combination of stocks & bonds)?
c) What is portfolio risk, return, and Sharpe Ratio of the optimal risky portfolio?
d) Using the table created above, the Sharpe Ratio of Stocks is 0.4667; the Sharpe Ratio of Bonds is 0.375; and the Sharpe Ratio of the optimal combination of stocks & bonds is 0.5374. Why does combining stocks & bonds result in a higher Sharpe Ratio than either asset by itself? In other words, what mechanism allows that phenomenon to occur? Hint: No calculations are needed.
e) Using the table above, plot the opportunity set of risky assets in Excel. Then vary the correlation between stocks and bonds from + 1 to -1 and describe the changes in shape of the efficient frontier as you do so. Upload the Excel file that contains the table & graph. Also include in Excel file a description of the efficient frontier's shape as you vary the correlation.
f) Using the graph of the opportunity set of risky assets created above: Change the correlation of stocks and bonds back to 0.25 and observe the shape of the efficient frontier.
g) Now change the correlation between stocks & bonds to -1. What is the lowest risk achievable? Starting at the point that corresponds to 100% Bonds & 0% Stocks, describe what happens to portfolio risk and return as you increase the stock allocation and decrease the bond allocation? Why is this happening?
A . C D E Return Risk Sharpe Ratio Stock Allocation 0 % Bond Allocation 100% 95% 90% 5% 10% 15% 85% 20% 25% 30% 35% 80% 75% 70% 65% 60% 40% 45% 50% 55% 60% 55% 50% 45% 40% 35% 30% 25% 20% 65% 70% 75% 80% 85% 15% 10% 90% 95% 5% 100% 0% A . C D E Return Risk Sharpe Ratio Stock Allocation 0 % Bond Allocation 100% 95% 90% 5% 10% 15% 85% 20% 25% 30% 35% 80% 75% 70% 65% 60% 40% 45% 50% 55% 60% 55% 50% 45% 40% 35% 30% 25% 20% 65% 70% 75% 80% 85% 15% 10% 90% 95% 5% 100% 0%Step by Step Solution
There are 3 Steps involved in it
Step: 1

Get Instant Access to Expert-Tailored Solutions
See step-by-step solutions with expert insights and AI powered tools for academic success
Step: 2

Step: 3
Ace Your Homework with AI
Get the answers you need in no time with our AI-driven, step-by-step assistance
Get Started
Advanced Auditing And Assurance
Authors: Louise Kelly
1st Edition
978-1908199362