

Question
You are looking to combine stock & bond portfolios. The risk and return data are as follows: Risk-free rate = 3.0% E(rtn) stocks = 10%
You are looking to combine stock & bond portfolios. The risk and return data are as follows:
Risk-free rate = 3.0%
E(rtn) stocks = 10%
Volatility stocks = 15%
E(rtn) bonds = 6%
Volatility bonds = 8%
The correlation between stocks & bonds is 0.25.
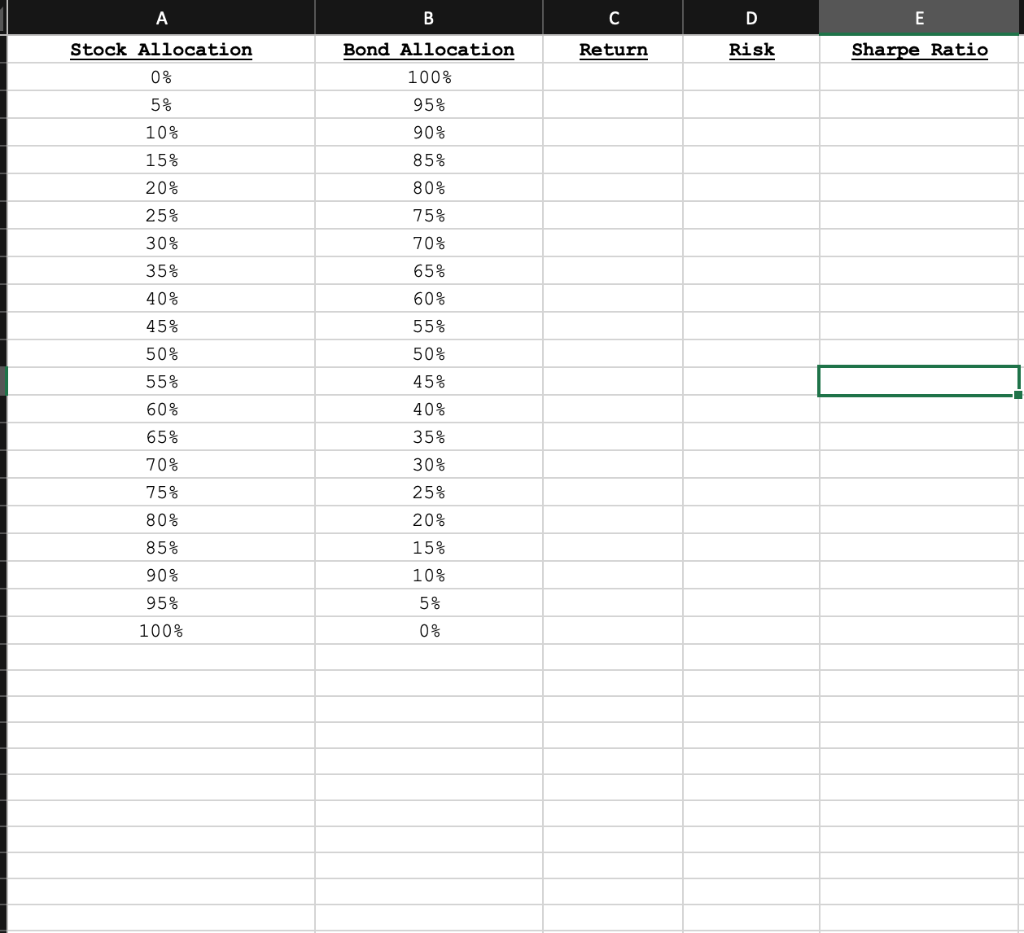
a) Complete the Excel table (see below) showing varying proportions of stocks & bonds in 5 percentage point increments.
When calculating return, risk and Sharpe Ratio, you MUST use absolute cell references for the risk, return and correlation of stocks and bonds, and the risk-free rate. Do NOT hard-code any numbers in your calculations.
Upload completed table in Excel:
b) What is the optimal risky portfolio (e.g. the optimal combination of stocks & bonds)?
c) What is portfolio risk, return, and Sharpe Ratio of the optimal risky portfolio?
d) Using the table created above, the Sharpe Ratio of Stocks is 0.4667; the Sharpe Ratio of Bonds is 0.375; and the Sharpe Ratio of the optimal combination of stocks & bonds is 0.5374. Why does combining stocks & bonds result in a higher Sharpe Ratio than either asset by itself? In other words, what mechanism allows that phenomenon to occur? Hint: No calculations are needed.
e) Using the table above, plot the opportunity set of risky assets in Excel.
Then vary the correlation between stocks and bonds from + 1 to -1 and describe the changes in shape of the efficient frontier as you do so.
Upload the Excel file that contains the table & graph.
Also include in Excel file a description of the efficient frontier's shape as you vary the correlation.
f) Using the graph of the opportunity set of risky assets created above:
Change the correlation of stocks and bonds back to 0.25 and observe the shape of the efficient frontier.
g) Now change the correlation between stocks & bonds to -1. What is the lowest risk achievable?
Starting at the point that corresponds to 100% Bonds & 0% Stocks, describe what happens to portfolio risk and return as you increase the stock allocation and decrease the bond allocation? Why is this happening?
A . C D E Return Risk Sharpe Ratio Stock Allocation 0 % Bond Allocation 100% 95% 90% 5% 10% 15% 85% 20% 25% 30% 35% 80% 75% 70% 65% 60% 40% 45% 50% 55% 60% 55% 50% 45% 40% 35% 30% 25% 20% 65% 70% 75% 80% 85% 15% 10% 90% 95% 5% 100% 0% A . C D E Return Risk Sharpe Ratio Stock Allocation 0 % Bond Allocation 100% 95% 90% 5% 10% 15% 85% 20% 25% 30% 35% 80% 75% 70% 65% 60% 40% 45% 50% 55% 60% 55% 50% 45% 40% 35% 30% 25% 20% 65% 70% 75% 80% 85% 15% 10% 90% 95% 5% 100% 0%Step by Step Solution
There are 3 Steps involved in it
Step: 1

Get Instant Access to Expert-Tailored Solutions
See step-by-step solutions with expert insights and AI powered tools for academic success
Step: 2

Step: 3
Ace Your Homework with AI
Get the answers you need in no time with our AI-driven, step-by-step assistance
Get Started
Auditor 1 A Person Who Conducts An Audit. 2 Someone Who Arrives After The Battle And Bayonets The Wounded.
Authors: Day By J.
1st Edition
B09NHD98BP, 979-8781611843