Answered step by step
Verified Expert Solution
Question
1 Approved Answer
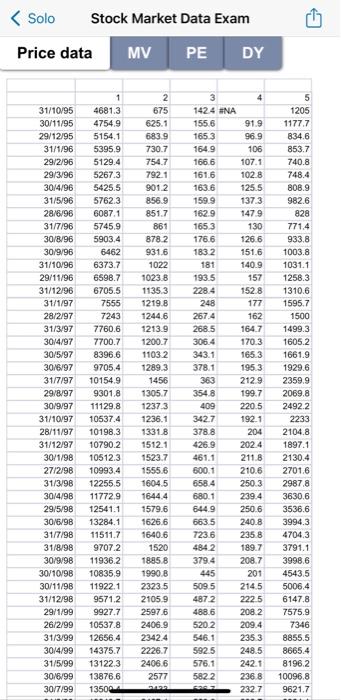
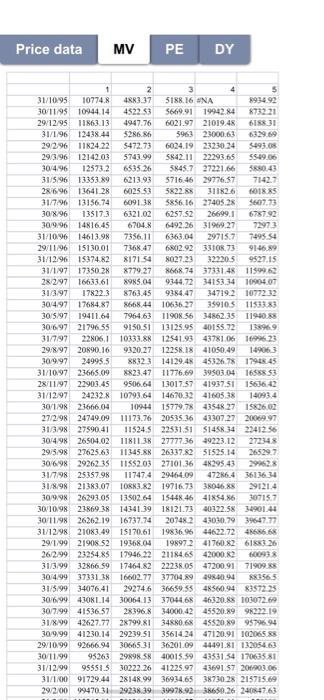
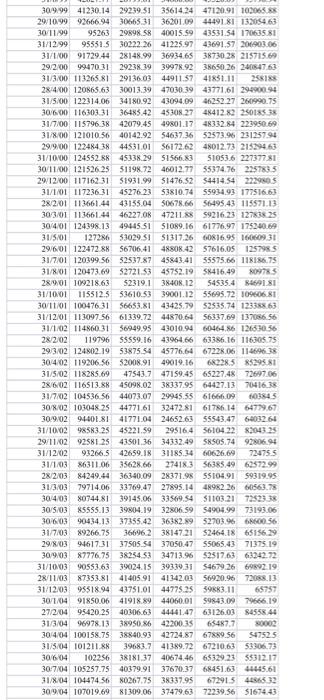
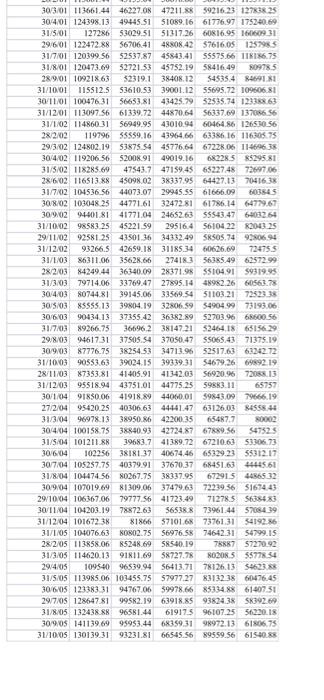
You are presented with the monthly stock prices of five (5) listed companies labeled Stock Prices. You are also presented with the market capitalization figures
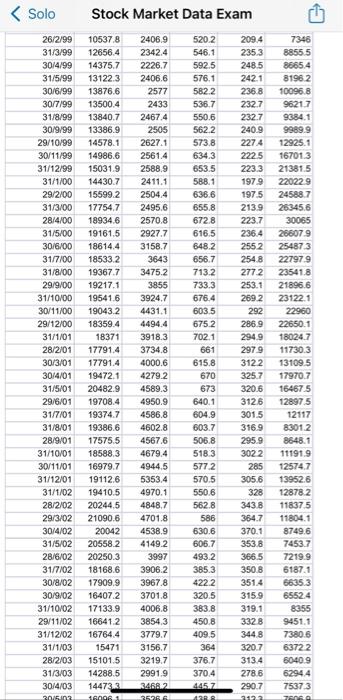
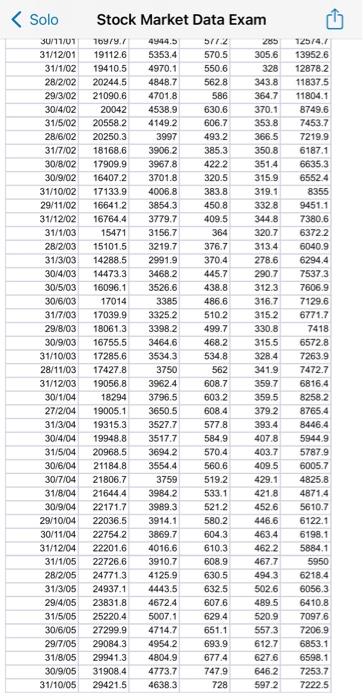
You are presented with the monthly stock prices of five (5) listed companies labeled Stock Prices. You are also presented with the market capitalization figures of these companies labelled MV. Note that columns for stock prices correspond with columns for capitalization. Data are for the period October 31, 1995 to October 31, 2005.
In the following exercises, use the five (5) companies with complete data over the ten-year period. You will use excel throughout in these exercises. Allotted marks are indicated.
1. Compute the holding period returns from the prices of the five stocks thatyou have selected and obtain the expected return and the risk of each stock. Plot a graph with the expected return on the vertical axis and risk on the horizontal axis. Assess if there is a risk return relationship in the five stocks selected.
(6 marks)
2. (i)Using the market capitalization figures, generate an index based on the five stocks. Set the base of index to be equal to 100 by selecting any of the dates of choice using the market capitalization of that date as your base capitalization. Kindly indicate clearly what this date is as well as the capitalization of that date. Generate the index as well as the returns of the index. Plot the time series of both the index and the returns.
(6 marks)
(ii) Run a regression of the returns of each of the five stocks against the returns of the market index and measure the five slopes. What is the importance of the measurement of these slopes as far as investment is concerned? What is the significance of the are the slopes measuring?
(7 marks)
3. In this exercise, select any two (AandB) of the five companies to form a two- asset portfolio. Combine the companies so that A has the following percentage weights, 100, 90, 80, 70, 60, 50, 40, 30, 20, 10, and 0.
a. Compute the risk and the expected return of each portfolio.
(7 marks)
b. Plot a graph of expected return of the portfolio on the vertical axis and the risk on the horizontal axis.
(7 marks)
c. On your graph identify
(i)the mean-variance frontier,
(ii)the efficient frontier
(iii) the inefficient frontier
(iv) the minimum variance point. Explain the significance of these frontiers or points in investment.
(7 marks)
Step by Step Solution
There are 3 Steps involved in it
Step: 1

Get Instant Access to Expert-Tailored Solutions
See step-by-step solutions with expert insights and AI powered tools for academic success
Step: 2

Step: 3

Ace Your Homework with AI
Get the answers you need in no time with our AI-driven, step-by-step assistance
Get Started


