You are required to access of both BCE Inc. and TELUS Corporation for their years ended December 31, 2018 from the companies respective websites.
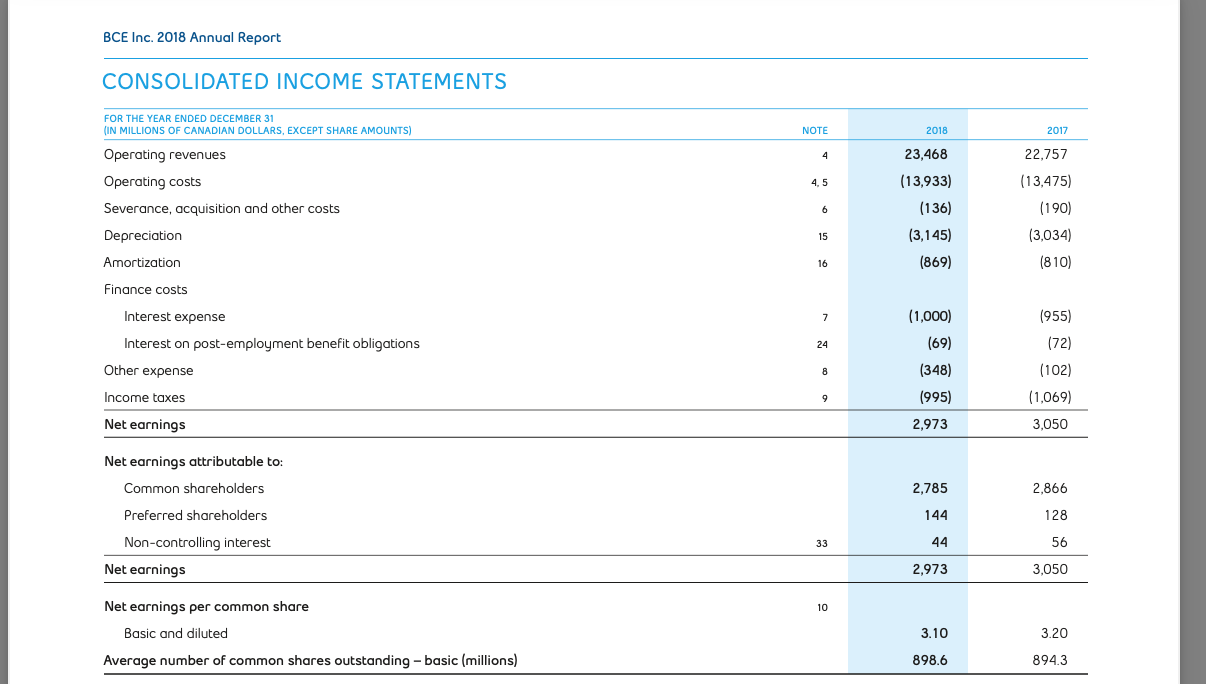
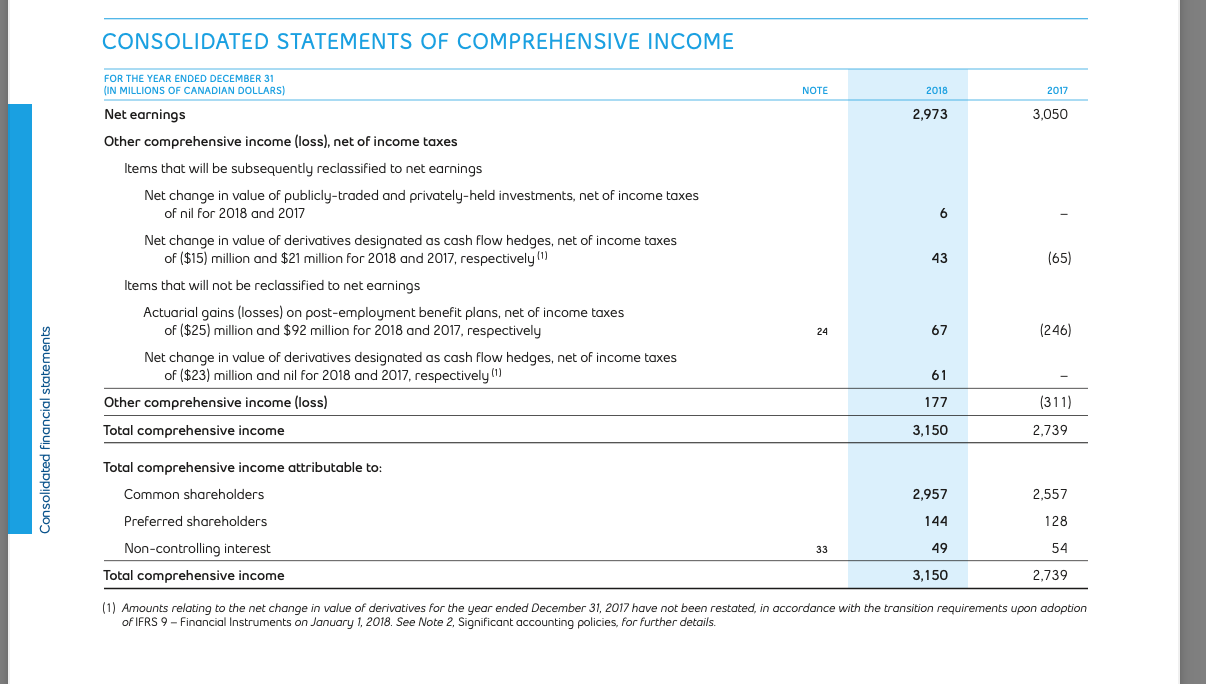
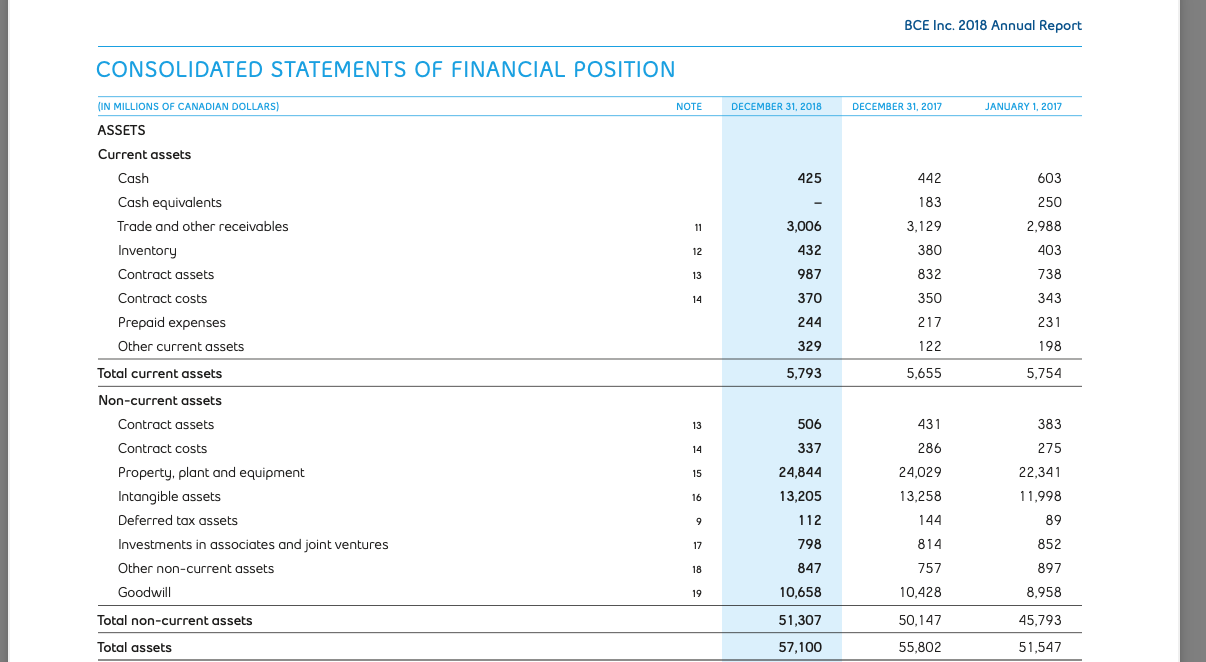
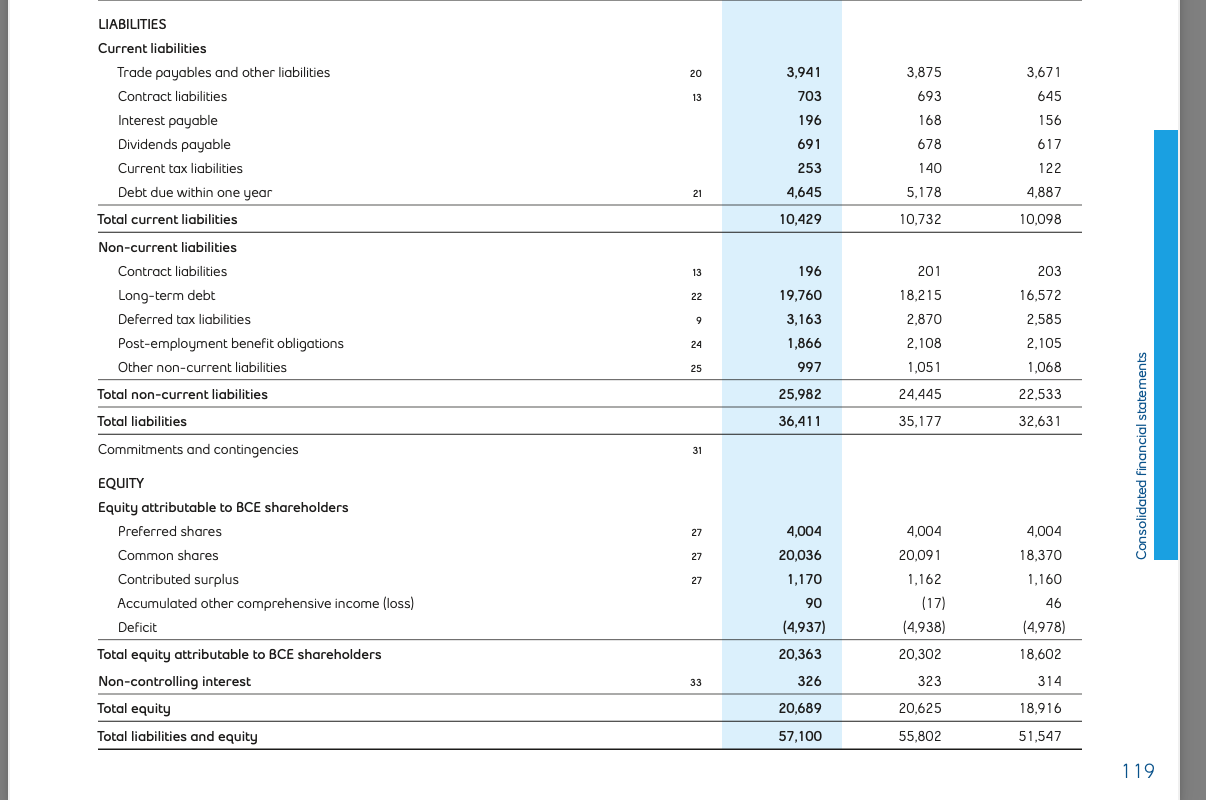
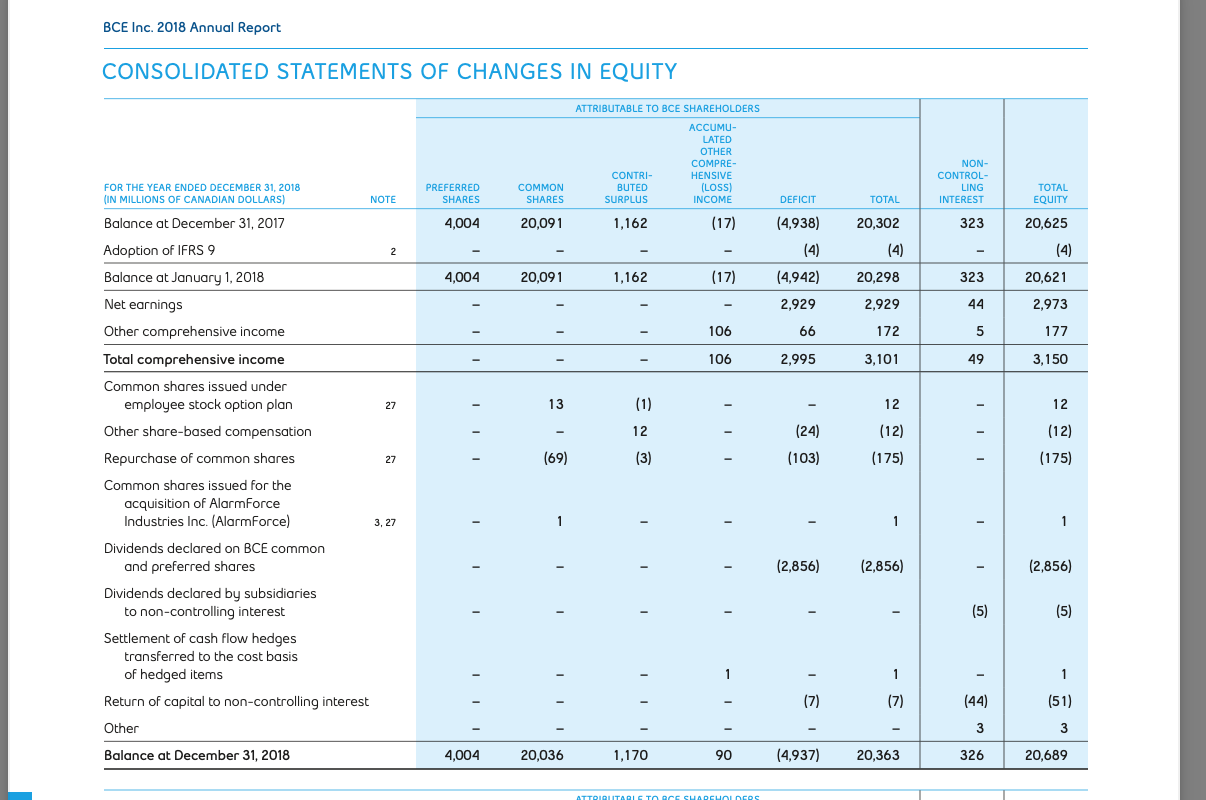
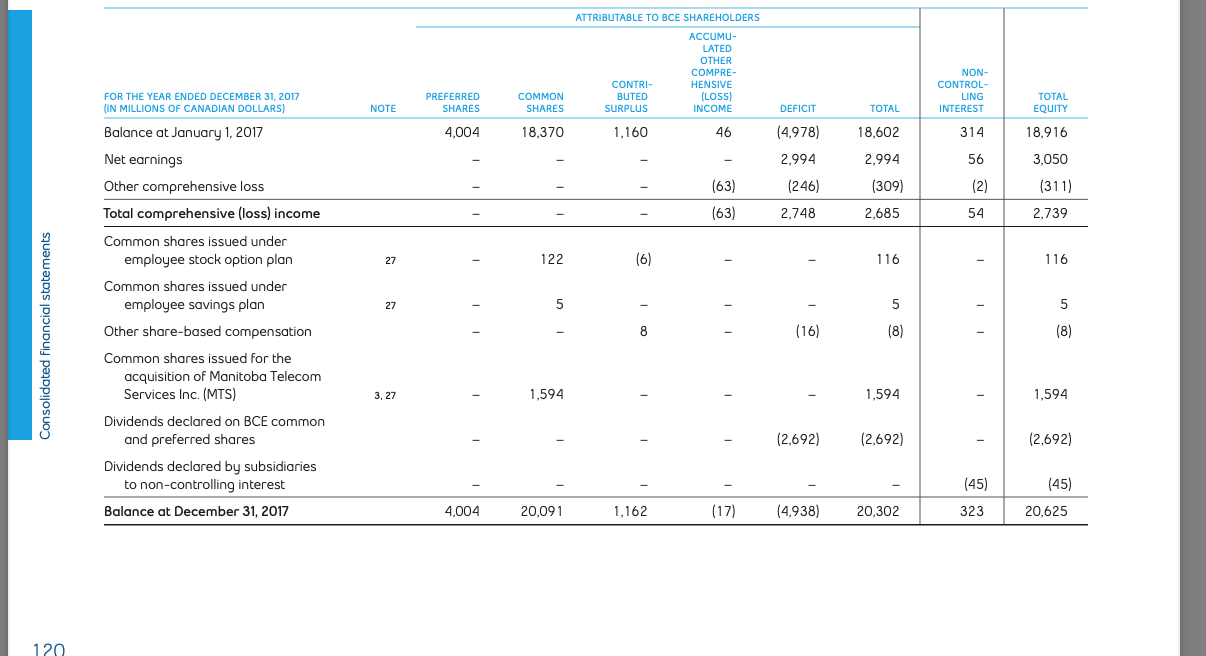
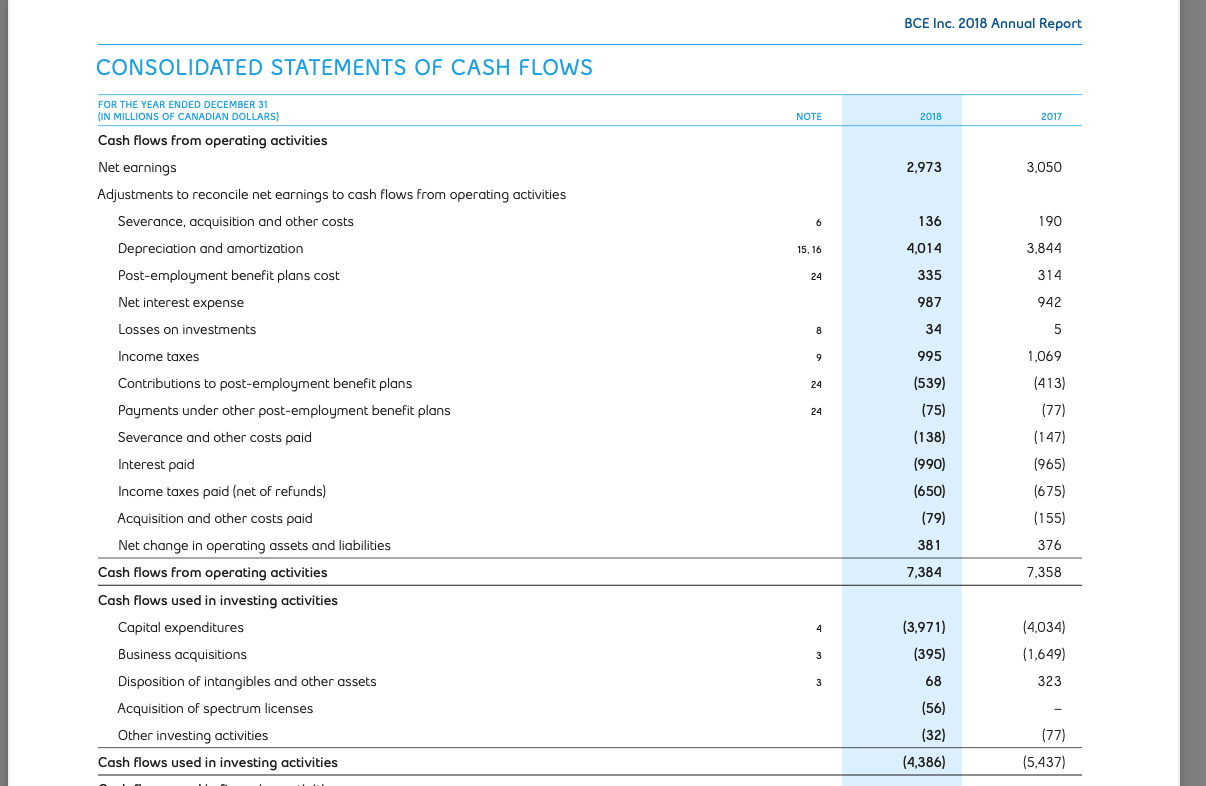
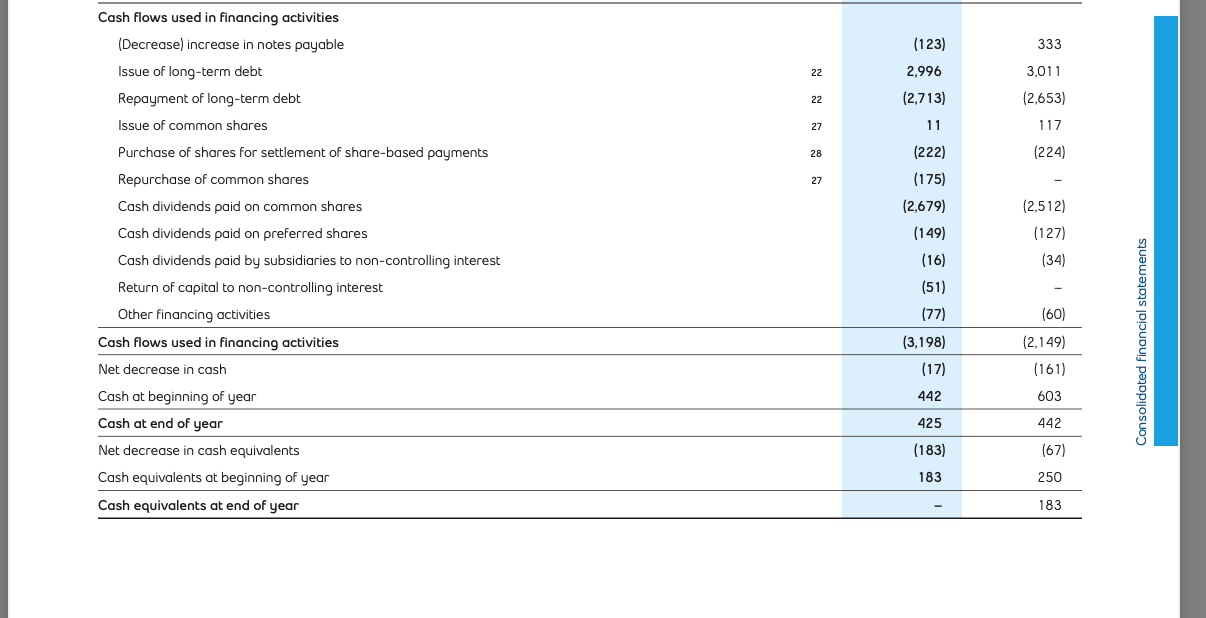
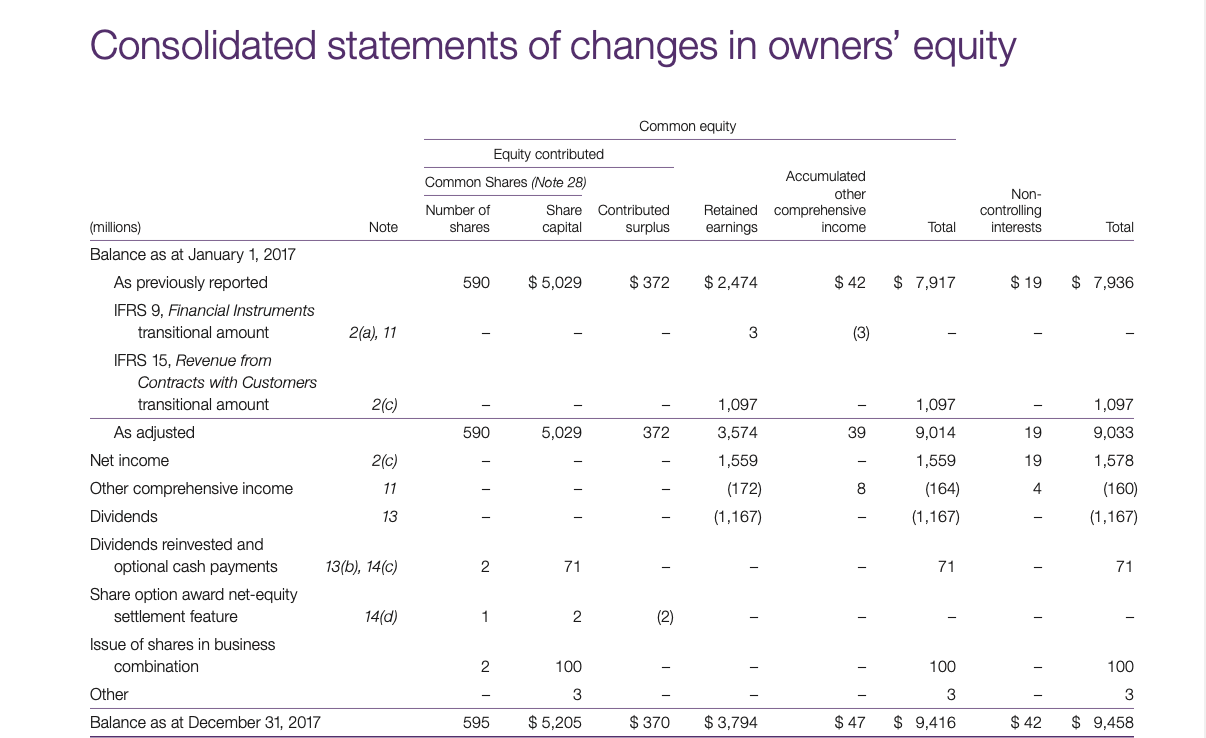
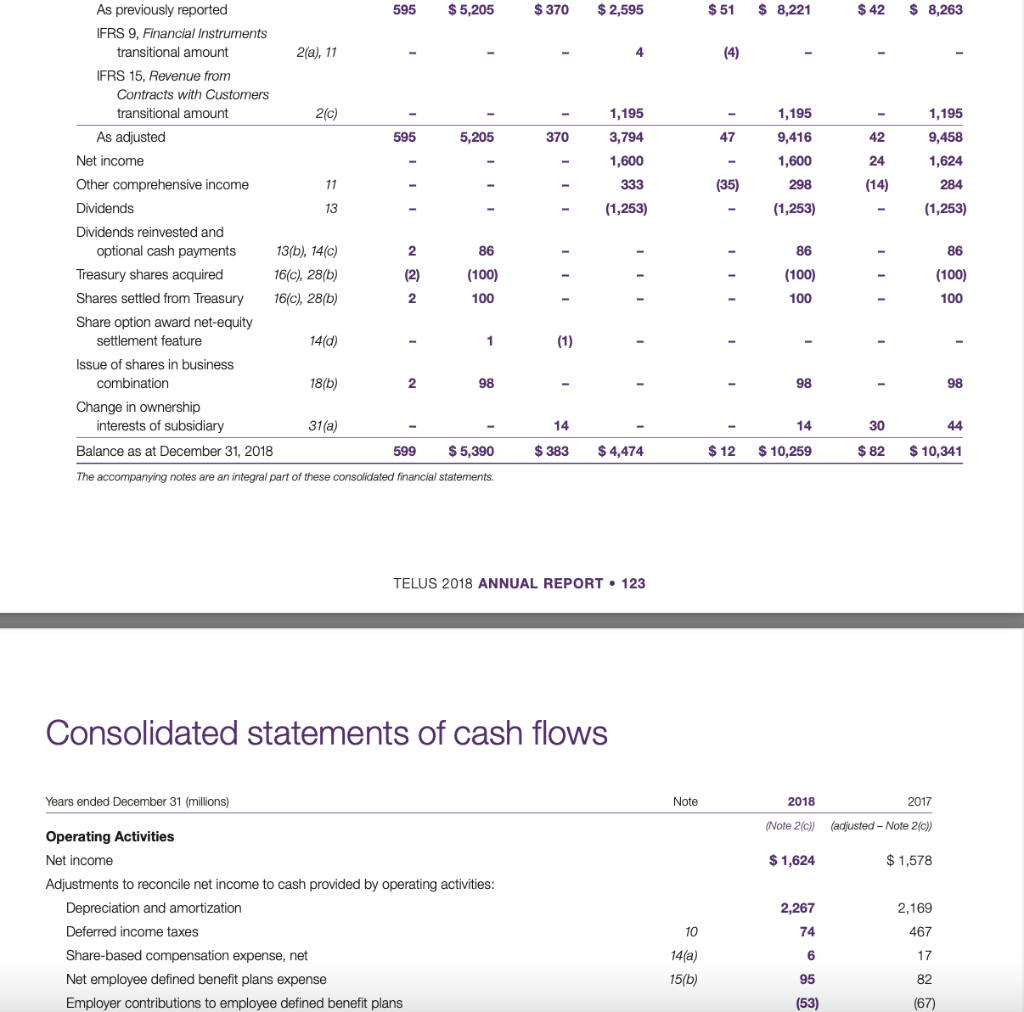
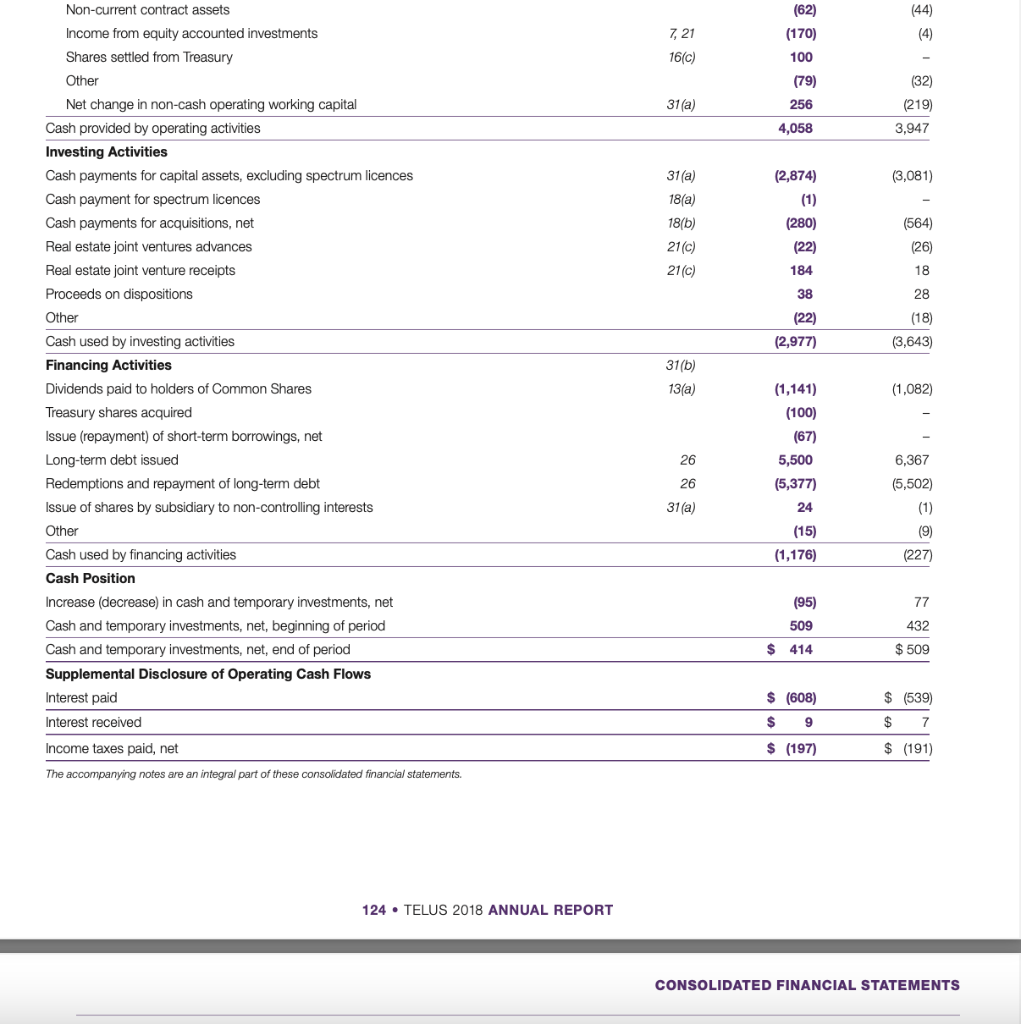
BCE Inc. 2018 Annual Report CONSOLIDATED INCOME STATEMENTS FOR THE YEAR ENDED DECEMBER 31 (IN MILLIONS OF CANADIAN DOLLARS, EXCEPT SHARE AMOUNTS) NOTE 2018 2017 4 23,468 22.757 4,5 Operating revenues Operating costs Severance, acquisition and other costs Depreciation 6 (13,933) (136) (3,145) (869) (13,475) (190) (3,034) (810) 15 Amortization 16 Finance costs 7 (1,000) (955) 24 (69) (72) Interest expense Interest on post-employment benefit obligations Other expense Income taxes 8 (348) (995) (102) (1,069) 9 Net earnings 2,973 3,050 Net earnings attributable to: Common shareholders 2,785 2,866 Preferred shareholders 144 128 33 44 56 Non-controlling interest Net earnings 2,973 3,050 Net earnings per common share 10 Basic and diluted 3.10 3.20 Average number of common shares outstanding - basic (millions) 898.6 894.3 CONSOLIDATED STATEMENTS OF COMPREHENSIVE INCOME FOR THE YEAR ENDED DECEMBER 31 (IN MILLIONS OF CANADIAN DOLLARS) NOTE 2018 2017 2,973 3,050 6 43 (65) Net earnings Other comprehensive income (loss), net of income taxes Items that will be subsequently reclassified to net earnings Net change in value of publicly-traded and privately-held investments, net of income taxes of nil for 2018 and 2017 Net change in value of derivatives designated as cash flow hedges, net of income taxes of ($15) million and $21 million for 2018 and 2017, respectively Items that will not be reclassified to net earnings Actuarial gains (losses) on post-employment benefit plans, net of income taxes of ($25) million and $92 million for 2018 and 2017, respectively Net change in value of derivatives designated as cash flow hedges, net of income taxes of ($23) million and nil for 2018 and 2017, respectively Other comprehensive income (loss) Total comprehensive income 24 67 (246) 61 177 (311) Consolidated financial statements 3,150 2.739 Total comprehensive income attributable to: Common shareholders 2,957 2,557 Preferred shareholders 144 128 33 49 54 Non-controlling interest Total comprehensive income 3,150 2.739 accordance with the transition requirements upon adoption (1) Amounts relating to the net change in value of derivatives for the year ended December 31, 2017 have not been restated, of IFRS 9 - Financial Instruments on January 1, 2018. See Note 2, Significant accounting policies, for further details. BCE Inc. 2018 Annual Report CONSOLIDATED STATEMENTS OF FINANCIAL POSITION (IN MILLIONS OF CANADIAN DOLLARS) NOTE DECEMBER 31, 2018 DECEMBER 31, 2017 JANUARY 1, 2017 ASSETS Current assets 425 442 603 183 250 11 3,006 3,129 2,988 12 432 380 403 Cash Cash equivalents Trade and other receivables Inventory Contract assets Contract costs Prepaid expenses Other current assets Total current assets 13 987 738 14 370 832 350 217 343 231 244 329 122 198 5,793 5,655 5,754 Non-current assets Contract assets 13 506 431 383 14 337 24,844 286 24,029 275 22,341 15 16 13,258 11,998 Contract costs Property, plant and equipment Intangible assets Deferred tax assets Investments in associates and joint ventures Other non-current assets Goodwill 9 144 13,205 112 798 847 17 814 89 852 897 18 757 19 10,658 10,428 8.958 Total non-current assets 51,307 50,147 45,793 Total assets 57.100 55,802 51,547 20 3,941 3,875 3,671 13 703 693 LIABILITIES Current liabilities Trade payables and other liabilities Contract liabilities Interest payable Dividends payable Current tax liabilities Debt due within one year Total current liabilities 168 196 691 678 645 156 617 122 4,887 253 140 21 4,645 5,178 10,429 10.732 10,098 13 196 201 203 22 19,760 18,215 16,572 Non-current liabilities Contract liabilities Long-term debt Deferred tax liabilities Post-employment benefit obligations Other non-current liabilities 9 3,163 2.870 2,585 24 1,866 2.108 2,105 25 997 1,051 1,068 Total non-current liabilities 25,982 24,445 22,533 Total liabilities 36,411 35,177 32,631 Commitments and contingencies 31 Consolidated financial statements EQUITY Equity attributable to BCE shareholders Preferred shares 27 4,004 4,004 4,004 20,091 27 20,036 18,370 27 1,170 1,160 Common shares Contributed surplus Accumulated other comprehensive income (loss) Deficit 90 1,162 (17) (4,938) 46 (4,937) (4,978) 20,363 20,302 18,602 Total equity attributable to BCE shareholders Non-controlling interest 33 326 323 314 Total equity 20,689 20,625 18,916 Total liabilities and equity 57,100 55,802 51,547 119 BCE Inc. 2018 Annual Report CONSOLIDATED STATEMENTS OF CHANGES IN EQUITY ATTRIBUTABLE TO BCE SHAREHOLDERS ACCUMU- LATED OTHER COMPRE- CONTRI- HENSIVE BUTED (LOSS) SURPLUS INCOME NON- CONTROL- LING INTEREST PREFERRED SHARES COMMON SHARES TOTAL EQUITY NOTE DEFICIT FOR THE YEAR ENDED DECEMBER 31, 2018 (IN MILLIONS OF CANADIAN DOLLARS) Balance at December 31, 2017 TOTAL 4,004 20,091 1,162 (17) (4,938) 323 20,625 20,302 (4) ( Adoption of IFRS 9 2 (4) (4) 4,004 20,091 1,162 (17) (4,942) 20,298 323 20,621 2,929 2,929 44 2,973 106 66 172 5 177 Balance at January 1, 2018 Net earnings Other comprehensive income Total comprehensive income Common shares issued under employee stock option plan Other share-based compensation 106 2,995 3,101 49 3,150 27 13 (1) 12 12 (12) 12 (24) (12) (175) 27 (69) (3) (103) (175) Repurchase of common shares Common shares issued for the acquisition of AlarmForce Industries Inc. (AlarmForce) 3, 27 1 - - 1 - 1 (2,856) (2,856) - (2,856) - - (5) (5) Dividends declared on BCE common and preferred shares Dividends declared by subsidiaries to non-controlling interest Settlement of cash flow hedges transferred to the cost basis of hedged items Return of capital to non-controlling interest 1 1 1 (7) (7) (51) (44) 3 Other 3 Balance at December 31, 2018 4,004 20,036 1,170 90 (4,937) 20,363 326 20,689 ATTOIDUITARISTOC SUADCUOCOS ATTRIBUTABLE TO BCE SHAREHOLDERS ACCUMU- LATED OTHER COMPRE- CONTRI HENSIVE BUTED SURPLUS INCOME 1,160 46 (LOSS) PREFERRED SHARES NON- CONTROL- LING INTEREST COMMON SHARES TOTAL EQUITY NOTE DEFICIT TOTAL 4,004 18,370 (4,978) 18,602 314 18,916 2.994 2.994 56 3,050 (63) (246) (309) (2) (311) FOR THE YEAR ENDED DECEMBER 31, 2017 (IN MILLIONS OF CANADIAN DOLLARS) Balance at January 1, 2017 Net earnings Other comprehensive loss Total comprehensive (loss) income Common shares issued under employee stock option plan Common shares issued under employee savings plan (63) 2.748 2,685 54 2.739 27 122 (6) 116 116 27 5 5 5 Consolidated financial statements Other share-based compensation 8 (16) (8) (8) 3, 27 1,594 1,594 - 1,594 Common shares issued for the acquisition of Manitoba Telecom Services Inc. (MTS) Dividends declared on BCE common and preferred shares Dividends declared by subsidiaries to non-controlling interest Balance at December 31, 2017 (2,692) (2,692) (2,692) (45) (45) 4,004 20,091 1,162 (17) (4,938) 20,302 323 20,625 120 BCE Inc. 2018 Annual Report CONSOLIDATED STATEMENTS OF CASH FLOWS NOTE 2018 2017 2,973 3,050 FOR THE YEAR ENDED DECEMBER 31 (IN MILLIONS OF CANADIAN DOLLARS) Cash flows from operating activities Net earnings Adjustments to reconcile net earnings to cash flows from operating activities Severance, acquisition and other costs Depreciation and amortization Post-employment benefit plans cost 136 190 15, 16 4,014 3,844 24 335 314 Net interest expense 987 942 Losses on investments 8 34 5 Income taxes 9 995 1,069 24 (413) 24 (77) (539) (75) (138) (990) (147) (965) (675) (650) (79) (155) 381 376 Contributions to post-employment benefit plans Payments under other post-employment benefit plans Severance and other costs paid Interest paid Income taxes paid (net of refunds) Acquisition and other costs paid Net change in operating assets and liabilities Cash flows from operating activities Cash flows used in investing activities Capital expenditures Business acquisitions Disposition of intangibles and other assets Acquisition of spectrum licenses Other investing activities Cash flows used in investing activities 7,384 7,358 (3,971) (395) (4.034) (1,649) 323 3 68 (56) (32) (77) (4,386) (5,437) (123) 333 22 2,996 3,011 22 (2,713) (2,653) 27 11 117 28 (224) 27 Cash flows used in financing activities (Decrease) increase in notes payable Issue of long-term debt Repayment of long-term debt Issue of common shares Purchase of shares for settlement of share-based payments Repurchase of common shares Cash dividends paid on common shares Cash dividends paid on preferred shares Cash dividends paid by subsidiaries to non-controlling interest Return of capital to non-controlling interest Other financing activities Cash flows used in financing activities Net decrease in cash (2,512) (222) (175) (2,679) (149) (16) (51) (127) (34) (77) (60) (3,198) (2,149) (161) Consolidated financial statements (17) 442 603 425 442 Cash at beginning of year Cash at end of year Net decrease in cash equivalents Cash equivalents at beginning of year Cash equivalents at end of year (183) (67) 183 250 183 120 TELUS 2018 ANNUAL REPORT CONSOLIDATED FINANCIAL STATEMENTS Consolidated statements of income and other comprehensive income Years ended December 31 (millions except per share amounts) Note 2018 2017 (Note 2(c)) (adjusted - Note 2(c)) Operating Revenues Service Equipment Revenues arising from contracts with customers Other operating income $ 11,882 2,213 14,095 $ 11,332 1,973 13,305 103 6 7 273 14,368 13,408 Operating Expenses Goods and services purchased Employee benefits expense Depreciation Amortization of intangible assets 6,368 2,896 5,904 2,594 8 17 1,617 1,669 598 18 552 10,667 11,531 2,837 2,741 9 661 573 2,168 2,176 552 10 Operating Income Financing costs Income Before Income Taxes Income taxes Net Income Other Comprehensive Income Items that may subsequently be reclassified to income Change in unrealized fair value of derivatives designated as cash flow hedges Foreign currency translation adjustment arising from translating financial statements of foreign operations 590 1,578 1,624 11 19 (18) (30) (48) 5 24 Items never subsequently reclassified to income Change in measurement of investment financial assets Employee defined benefit plan re-measurements (1) 333 332 (12) (172) (184) (160) $ 1,418 284 Comprehensive Income $ 1,908 Net Income Attributable to: Common Shares Non-controlling interests $ 1,600 $ 1,559 24 19 $ 1,624 $ 1,578 Comprehensive Income Attributable to: Common Shares Non-controlling interests $ 1,898 $ 1,395 10 23 $ 1,908 $ 1,418 12 Net Income Per Common Share Basic $ 2.68 $ 2.63 $ 2.68 $ 2.63 Diluted Total Weighted Average Common Shares Outstanding Basic 597 593 Diluted 597 593 The accompanying notes are an integral part of these consolidated financial statements. Consolidated statements of financial position As at (millions) Note December 31, 2018 December 31, 2017 January 1, 2017 (Note 2(c)) (adjusted - Note 2(c)) (Note 2(c)) $ $ $ 6(b) Assets Current assets Cash and temporary investments, net Accounts receivable Income and other taxes receivable Inventories Contract assets Prepaid expenses Current derivative assets 414 1,600 3 376 860 509 1,614 96 432 1,462 9 380 10 6(c) 20 4/h) 757 493 320 700 443 539 49 18 11 3,377 3,841 3,867 17 12,091 18 Non-current assets Property, plant and equipment, net Intangible assets, net Goodwill, net Contract assets Other long-term assets 18 6(0) 10,956 4,733 458 986 29,224 $ 33,065 11,368 10,658 4,236 396 528 27,186 $ 31,053 10,464 10,364 3,787 352 733 25,700 $ 29,077 20 22 $ $ $ 100 2,330 23 Liabilities and Owners' Equity Current liabilities Short-term borrowings Accounts payable and accrued liabilities Income and other taxes payable Dividends payable Advance billings and customer deposits Provisions Current maturities of long-term debt Current derivative liabilities 100 2,570 218 326 653 129 836 100 2,460 34 299 632 13 24 25 78 37 284 584 124 1,327 12 4,798 26 4(h) 9 1,404 33 5,040 4,841 25 Non-current liabilities Provisions Long-term debt Other long-term liabilities Deferred income taxes 26 728 13,265 738 3,152 17 883 27 511 12,256 847 2,941 16 555 395 11,604 736 2,511 10 15 246 22,724 21,595 20,044 Liabilities Owners' equity Common equity Non-controlling interests 28 9,416 10,259 82 42 9,014 19 9,033 $ 29,077 10,341 $ 33,065 9,458 $ 31,053 29 Contingent Liabilities The accompanying notes are an integral part of these consolidated financial statements. Consolidated statements of changes in owners' equity Common equity Equity contributed Common Shares (Note 28) Accumulated other Retained comprehensive earnings income Number of shares Non- controlling interests Share Contributed capita surplus Note Total Total 590 $ 5,029 $ 372 $ 2,474 $ 42 $ 7,917 $ 19 $ 7,936 (millions) Balance as at January 1, 2017 As previously reported IFRS 9, Financial Instruments transitional amount IFRS 15, Revenue from Contracts with Customers transitional amount 2(a), 11 3 (3) 2(c) 1,097 1,097 1,097 As adjusted 590 5,029 372 3,574 39 19 9,033 Net income 20) 19 9,014 1,559 (164) (1,167) 11 1,559 (172) (1,167) 8 Other comprehensive income Dividends 4 1,578 (160) (1,167) 13 13(b), 14(c) 2 71 71 71 Dividends reinvested and optional cash payments Share option award net-equity settlement feature 14(d) 1 2 (2) Issue of shares in business combination Other 2 100 100 100 3 3 3 Balance as at December 31, 2017 595 $ 5,205 $ 370 $3,794 $ 47 $ 9,416 $ 42 $ 9,458 $ 370 $ 2,595 $ 51 $ 8,221 $ 42 $ 8,263 $ 8,263 4 (4) 1,195 1,195 370 47 42 1,195 3,794 1,600 333 (1,253) 24 9,416 1,600 298 (1,253) 9,458 1,624 284 (35) (14) (1,253) As previously reported 595 $ 5,205 IFRS 9, Financial Instruments transitional amount 2(a), 11 IFRS 15, Revenue from Contracts with Customers transitional amount 20) As adjusted 595 5,205 Net income Other comprehensive income 11 Dividends 13 Dividends reinvested and optional cash payments 13(b), 140) 2 86 Treasury shares acquired 16(c), 28(b) (2) (100) Shares settled from Treasury 16(c), 28(b) 2 100 Share option award net-equity settlement feature 14(d) 1 Issue of shares in business combination 2 98 Change in ownership interests of subsidiary 31(a) Balance as at December 31, 2018 599 $ 5,390 The accompanying notes are an integral part of these consolidated financial statements. 86 86 (100) (100) 100 100 (1) 18(b) 98 98 14 14 30 44 $ 383 $ 4,474 $ 12 $ 10,259 $ 82 $ 10,341 TELUS 2018 ANNUAL REPORT 123 Consolidated statements of cash flows Years ended December 31 (millions) Note 2018 2017 (Note 2(c)) (adjusted - Note 2(c)) $ 1,624 $ 1,578 2,267 Operating Activities Net income Adjustments to reconcile net income to cash provided by operating activities: Depreciation and amortization Deferred income taxes Share-based compensation expense, net Net employee defined benefit plans expense Employer contributions to employee defined benefit plans 2,169 467 10 74 6 17 14(a) 15(b) 95 82 (53) (67 (44) 7, 21 (4) (62) (170) 100 (79) 16(c) 31(a) 256 (32) (219) 3,947 4,058 (3,081) (2,874) (1) 31(a) 18(a) 18(b) 21(c) 21(c) (280) (564) (26) (22) 184 18 38 28 (22) (18) (3,643) (2,977) Non-current contract assets Income from equity accounted investments Shares settled from Treasury Other Net change in non-cash operating working capital Cash provided by operating activities Investing Activities Cash payments for capital assets, excluding spectrum licences Cash payment for spectrum licences Cash payments for acquisitions, net Real estate joint ventures advances Real estate joint venture receipts Proceeds on dispositions Other Cash used by investing activities Financing Activities Dividends paid to holders of Common Shares Treasury shares acquired Issue (repayment) of short-term borrowings, net Long-term debt issued Redemptions and repayment of long-term debt Issue of shares by subsidiary to non-controlling interests Other Cash used by financing activities Cash Position Increase (decrease in cash and temporary investments, net Cash and temporary investments, net, beginning of period Cash and temporary investments, net, end of period Supplemental Disclosure of Operating Cash Flows Interest paid Interest received 31(b) 13(a) (1,082) (1,141) (100) (67) 5,500 (5,377) 24 26 6,367 26 (5,502) (1) 31(a) (15) (1,176) (9) (227) (95) 77 509 432 $ 509 $ 414 $ (539) $ (608) $ 9 $ 7 $ (197) $ (191) Income taxes paid, net The accompanying notes are an integral part of these consolidated financial statements. 124. TELUS 2018 ANNUAL REPORT CONSOLIDATED FINANCIAL STATEMENTS BCE Inc. 2018 Annual Report CONSOLIDATED INCOME STATEMENTS FOR THE YEAR ENDED DECEMBER 31 (IN MILLIONS OF CANADIAN DOLLARS, EXCEPT SHARE AMOUNTS) NOTE 2018 2017 4 23,468 22.757 4,5 Operating revenues Operating costs Severance, acquisition and other costs Depreciation 6 (13,933) (136) (3,145) (869) (13,475) (190) (3,034) (810) 15 Amortization 16 Finance costs 7 (1,000) (955) 24 (69) (72) Interest expense Interest on post-employment benefit obligations Other expense Income taxes 8 (348) (995) (102) (1,069) 9 Net earnings 2,973 3,050 Net earnings attributable to: Common shareholders 2,785 2,866 Preferred shareholders 144 128 33 44 56 Non-controlling interest Net earnings 2,973 3,050 Net earnings per common share 10 Basic and diluted 3.10 3.20 Average number of common shares outstanding - basic (millions) 898.6 894.3 CONSOLIDATED STATEMENTS OF COMPREHENSIVE INCOME FOR THE YEAR ENDED DECEMBER 31 (IN MILLIONS OF CANADIAN DOLLARS) NOTE 2018 2017 2,973 3,050 6 43 (65) Net earnings Other comprehensive income (loss), net of income taxes Items that will be subsequently reclassified to net earnings Net change in value of publicly-traded and privately-held investments, net of income taxes of nil for 2018 and 2017 Net change in value of derivatives designated as cash flow hedges, net of income taxes of ($15) million and $21 million for 2018 and 2017, respectively Items that will not be reclassified to net earnings Actuarial gains (losses) on post-employment benefit plans, net of income taxes of ($25) million and $92 million for 2018 and 2017, respectively Net change in value of derivatives designated as cash flow hedges, net of income taxes of ($23) million and nil for 2018 and 2017, respectively Other comprehensive income (loss) Total comprehensive income 24 67 (246) 61 177 (311) Consolidated financial statements 3,150 2.739 Total comprehensive income attributable to: Common shareholders 2,957 2,557 Preferred shareholders 144 128 33 49 54 Non-controlling interest Total comprehensive income 3,150 2.739 accordance with the transition requirements upon adoption (1) Amounts relating to the net change in value of derivatives for the year ended December 31, 2017 have not been restated, of IFRS 9 - Financial Instruments on January 1, 2018. See Note 2, Significant accounting policies, for further details. BCE Inc. 2018 Annual Report CONSOLIDATED STATEMENTS OF FINANCIAL POSITION (IN MILLIONS OF CANADIAN DOLLARS) NOTE DECEMBER 31, 2018 DECEMBER 31, 2017 JANUARY 1, 2017 ASSETS Current assets 425 442 603 183 250 11 3,006 3,129 2,988 12 432 380 403 Cash Cash equivalents Trade and other receivables Inventory Contract assets Contract costs Prepaid expenses Other current assets Total current assets 13 987 738 14 370 832 350 217 343 231 244 329 122 198 5,793 5,655 5,754 Non-current assets Contract assets 13 506 431 383 14 337 24,844 286 24,029 275 22,341 15 16 13,258 11,998 Contract costs Property, plant and equipment Intangible assets Deferred tax assets Investments in associates and joint ventures Other non-current assets Goodwill 9 144 13,205 112 798 847 17 814 89 852 897 18 757 19 10,658 10,428 8.958 Total non-current assets 51,307 50,147 45,793 Total assets 57.100 55,802 51,547 20 3,941 3,875 3,671 13 703 693 LIABILITIES Current liabilities Trade payables and other liabilities Contract liabilities Interest payable Dividends payable Current tax liabilities Debt due within one year Total current liabilities 168 196 691 678 645 156 617 122 4,887 253 140 21 4,645 5,178 10,429 10.732 10,098 13 196 201 203 22 19,760 18,215 16,572 Non-current liabilities Contract liabilities Long-term debt Deferred tax liabilities Post-employment benefit obligations Other non-current liabilities 9 3,163 2.870 2,585 24 1,866 2.108 2,105 25 997 1,051 1,068 Total non-current liabilities 25,982 24,445 22,533 Total liabilities 36,411 35,177 32,631 Commitments and contingencies 31 Consolidated financial statements EQUITY Equity attributable to BCE shareholders Preferred shares 27 4,004 4,004 4,004 20,091 27 20,036 18,370 27 1,170 1,160 Common shares Contributed surplus Accumulated other comprehensive income (loss) Deficit 90 1,162 (17) (4,938) 46 (4,937) (4,978) 20,363 20,302 18,602 Total equity attributable to BCE shareholders Non-controlling interest 33 326 323 314 Total equity 20,689 20,625 18,916 Total liabilities and equity 57,100 55,802 51,547 119 BCE Inc. 2018 Annual Report CONSOLIDATED STATEMENTS OF CHANGES IN EQUITY ATTRIBUTABLE TO BCE SHAREHOLDERS ACCUMU- LATED OTHER COMPRE- CONTRI- HENSIVE BUTED (LOSS) SURPLUS INCOME NON- CONTROL- LING INTEREST PREFERRED SHARES COMMON SHARES TOTAL EQUITY NOTE DEFICIT FOR THE YEAR ENDED DECEMBER 31, 2018 (IN MILLIONS OF CANADIAN DOLLARS) Balance at December 31, 2017 TOTAL 4,004 20,091 1,162 (17) (4,938) 323 20,625 20,302 (4) ( Adoption of IFRS 9 2 (4) (4) 4,004 20,091 1,162 (17) (4,942) 20,298 323 20,621 2,929 2,929 44 2,973 106 66 172 5 177 Balance at January 1, 2018 Net earnings Other comprehensive income Total comprehensive income Common shares issued under employee stock option plan Other share-based compensation 106 2,995 3,101 49 3,150 27 13 (1) 12 12 (12) 12 (24) (12) (175) 27 (69) (3) (103) (175) Repurchase of common shares Common shares issued for the acquisition of AlarmForce Industries Inc. (AlarmForce) 3, 27 1 - - 1 - 1 (2,856) (2,856) - (2,856) - - (5) (5) Dividends declared on BCE common and preferred shares Dividends declared by subsidiaries to non-controlling interest Settlement of cash flow hedges transferred to the cost basis of hedged items Return of capital to non-controlling interest 1 1 1 (7) (7) (51) (44) 3 Other 3 Balance at December 31, 2018 4,004 20,036 1,170 90 (4,937) 20,363 326 20,689 ATTOIDUITARISTOC SUADCUOCOS ATTRIBUTABLE TO BCE SHAREHOLDERS ACCUMU- LATED OTHER COMPRE- CONTRI HENSIVE BUTED SURPLUS INCOME 1,160 46 (LOSS) PREFERRED SHARES NON- CONTROL- LING INTEREST COMMON SHARES TOTAL EQUITY NOTE DEFICIT TOTAL 4,004 18,370 (4,978) 18,602 314 18,916 2.994 2.994 56 3,050 (63) (246) (309) (2) (311) FOR THE YEAR ENDED DECEMBER 31, 2017 (IN MILLIONS OF CANADIAN DOLLARS) Balance at January 1, 2017 Net earnings Other comprehensive loss Total comprehensive (loss) income Common shares issued under employee stock option plan Common shares issued under employee savings plan (63) 2.748 2,685 54 2.739 27 122 (6) 116 116 27 5 5 5 Consolidated financial statements Other share-based compensation 8 (16) (8) (8) 3, 27 1,594 1,594 - 1,594 Common shares issued for the acquisition of Manitoba Telecom Services Inc. (MTS) Dividends declared on BCE common and preferred shares Dividends declared by subsidiaries to non-controlling interest Balance at December 31, 2017 (2,692) (2,692) (2,692) (45) (45) 4,004 20,091 1,162 (17) (4,938) 20,302 323 20,625 120 BCE Inc. 2018 Annual Report CONSOLIDATED STATEMENTS OF CASH FLOWS NOTE 2018 2017 2,973 3,050 FOR THE YEAR ENDED DECEMBER 31 (IN MILLIONS OF CANADIAN DOLLARS) Cash flows from operating activities Net earnings Adjustments to reconcile net earnings to cash flows from operating activities Severance, acquisition and other costs Depreciation and amortization Post-employment benefit plans cost 136 190 15, 16 4,014 3,844 24 335 314 Net interest expense 987 942 Losses on investments 8 34 5 Income taxes 9 995 1,069 24 (413) 24 (77) (539) (75) (138) (990) (147) (965) (675) (650) (79) (155) 381 376 Contributions to post-employment benefit plans Payments under other post-employment benefit plans Severance and other costs paid Interest paid Income taxes paid (net of refunds) Acquisition and other costs paid Net change in operating assets and liabilities Cash flows from operating activities Cash flows used in investing activities Capital expenditures Business acquisitions Disposition of intangibles and other assets Acquisition of spectrum licenses Other investing activities Cash flows used in investing activities 7,384 7,358 (3,971) (395) (4.034) (1,649) 323 3 68 (56) (32) (77) (4,386) (5,437) (123) 333 22 2,996 3,011 22 (2,713) (2,653) 27 11 117 28 (224) 27 Cash flows used in financing activities (Decrease) increase in notes payable Issue of long-term debt Repayment of long-term debt Issue of common shares Purchase of shares for settlement of share-based payments Repurchase of common shares Cash dividends paid on common shares Cash dividends paid on preferred shares Cash dividends paid by subsidiaries to non-controlling interest Return of capital to non-controlling interest Other financing activities Cash flows used in financing activities Net decrease in cash (2,512) (222) (175) (2,679) (149) (16) (51) (127) (34) (77) (60) (3,198) (2,149) (161) Consolidated financial statements (17) 442 603 425 442 Cash at beginning of year Cash at end of year Net decrease in cash equivalents Cash equivalents at beginning of year Cash equivalents at end of year (183) (67) 183 250 183 120 TELUS 2018 ANNUAL REPORT CONSOLIDATED FINANCIAL STATEMENTS Consolidated statements of income and other comprehensive income Years ended December 31 (millions except per share amounts) Note 2018 2017 (Note 2(c)) (adjusted - Note 2(c)) Operating Revenues Service Equipment Revenues arising from contracts with customers Other operating income $ 11,882 2,213 14,095 $ 11,332 1,973 13,305 103 6 7 273 14,368 13,408 Operating Expenses Goods and services purchased Employee benefits expense Depreciation Amortization of intangible assets 6,368 2,896 5,904 2,594 8 17 1,617 1,669 598 18 552 10,667 11,531 2,837 2,741 9 661 573 2,168 2,176 552 10 Operating Income Financing costs Income Before Income Taxes Income taxes Net Income Other Comprehensive Income Items that may subsequently be reclassified to income Change in unrealized fair value of derivatives designated as cash flow hedges Foreign currency translation adjustment arising from translating financial statements of foreign operations 590 1,578 1,624 11 19 (18) (30) (48) 5 24 Items never subsequently reclassified to income Change in measurement of investment financial assets Employee defined benefit plan re-measurements (1) 333 332 (12) (172) (184) (160) $ 1,418 284 Comprehensive Income $ 1,908 Net Income Attributable to: Common Shares Non-controlling interests $ 1,600 $ 1,559 24 19 $ 1,624 $ 1,578 Comprehensive Income Attributable to: Common Shares Non-controlling interests $ 1,898 $ 1,395 10 23 $ 1,908 $ 1,418 12 Net Income Per Common Share Basic $ 2.68 $ 2.63 $ 2.68 $ 2.63 Diluted Total Weighted Average Common Shares Outstanding Basic 597 593 Diluted 597 593 The accompanying notes are an integral part of these consolidated financial statements. Consolidated statements of financial position As at (millions) Note December 31, 2018 December 31, 2017 January 1, 2017 (Note 2(c)) (adjusted - Note 2(c)) (Note 2(c)) $ $ $ 6(b) Assets Current assets Cash and temporary investments, net Accounts receivable Income and other taxes receivable Inventories Contract assets Prepaid expenses Current derivative assets 414 1,600 3 376 860 509 1,614 96 432 1,462 9 380 10 6(c) 20 4/h) 757 493 320 700 443 539 49 18 11 3,377 3,841 3,867 17 12,091 18 Non-current assets Property, plant and equipment, net Intangible assets, net Goodwill, net Contract assets Other long-term assets 18 6(0) 10,956 4,733 458 986 29,224 $ 33,065 11,368 10,658 4,236 396 528 27,186 $ 31,053 10,464 10,364 3,787 352 733 25,700 $ 29,077 20 22 $ $ $ 100 2,330 23 Liabilities and Owners' Equity Current liabilities Short-term borrowings Accounts payable and accrued liabilities Income and other taxes payable Dividends payable Advance billings and customer deposits Provisions Current maturities of long-term debt Current derivative liabilities 100 2,570 218 326 653 129 836 100 2,460 34 299 632 13 24 25 78 37 284 584 124 1,327 12 4,798 26 4(h) 9 1,404 33 5,040 4,841 25 Non-current liabilities Provisions Long-term debt Other long-term liabilities Deferred income taxes 26 728 13,265 738 3,152 17 883 27 511 12,256 847 2,941 16 555 395 11,604 736 2,511 10 15 246 22,724 21,595 20,044 Liabilities Owners' equity Common equity Non-controlling interests 28 9,416 10,259 82 42 9,014 19 9,033 $ 29,077 10,341 $ 33,065 9,458 $ 31,053 29 Contingent Liabilities The accompanying notes are an integral part of these consolidated financial statements. Consolidated statements of changes in owners' equity Common equity Equity contributed Common Shares (Note 28) Accumulated other Retained comprehensive earnings income Number of shares Non- controlling interests Share Contributed capita surplus Note Total Total 590 $ 5,029 $ 372 $ 2,474 $ 42 $ 7,917 $ 19 $ 7,936 (millions) Balance as at January 1, 2017 As previously reported IFRS 9, Financial Instruments transitional amount IFRS 15, Revenue from Contracts with Customers transitional amount 2(a), 11 3 (3) 2(c) 1,097 1,097 1,097 As adjusted 590 5,029 372 3,574 39 19 9,033 Net income 20) 19 9,014 1,559 (164) (1,167) 11 1,559 (172) (1,167) 8 Other comprehensive income Dividends 4 1,578 (160) (1,167) 13 13(b), 14(c) 2 71 71 71 Dividends reinvested and optional cash payments Share option award net-equity settlement feature 14(d) 1 2 (2) Issue of shares in business combination Other 2 100 100 100 3 3 3 Balance as at December 31, 2017 595 $ 5,205 $ 370 $3,794 $ 47 $ 9,416 $ 42 $ 9,458 $ 370 $ 2,595 $ 51 $ 8,221 $ 42 $ 8,263 $ 8,263 4 (4) 1,195 1,195 370 47 42 1,195 3,794 1,600 333 (1,253) 24 9,416 1,600 298 (1,253) 9,458 1,624 284 (35) (14) (1,253) As previously reported 595 $ 5,205 IFRS 9, Financial Instruments transitional amount 2(a), 11 IFRS 15, Revenue from Contracts with Customers transitional amount 20) As adjusted 595 5,205 Net income Other comprehensive income 11 Dividends 13 Dividends reinvested and optional cash payments 13(b), 140) 2 86 Treasury shares acquired 16(c), 28(b) (2) (100) Shares settled from Treasury 16(c), 28(b) 2 100 Share option award net-equity settlement feature 14(d) 1 Issue of shares in business combination 2 98 Change in ownership interests of subsidiary 31(a) Balance as at December 31, 2018 599 $ 5,390 The accompanying notes are an integral part of these consolidated financial statements. 86 86 (100) (100) 100 100 (1) 18(b) 98 98 14 14 30 44 $ 383 $ 4,474 $ 12 $ 10,259 $ 82 $ 10,341 TELUS 2018 ANNUAL REPORT 123 Consolidated statements of cash flows Years ended December 31 (millions) Note 2018 2017 (Note 2(c)) (adjusted - Note 2(c)) $ 1,624 $ 1,578 2,267 Operating Activities Net income Adjustments to reconcile net income to cash provided by operating activities: Depreciation and amortization Deferred income taxes Share-based compensation expense, net Net employee defined benefit plans expense Employer contributions to employee defined benefit plans 2,169 467 10 74 6 17 14(a) 15(b) 95 82 (53) (67 (44) 7, 21 (4) (62) (170) 100 (79) 16(c) 31(a) 256 (32) (219) 3,947 4,058 (3,081) (2,874) (1) 31(a) 18(a) 18(b) 21(c) 21(c) (280) (564) (26) (22) 184 18 38 28 (22) (18) (3,643) (2,977) Non-current contract assets Income from equity accounted investments Shares settled from Treasury Other Net change in non-cash operating working capital Cash provided by operating activities Investing Activities Cash payments for capital assets, excluding spectrum licences Cash payment for spectrum licences Cash payments for acquisitions, net Real estate joint ventures advances Real estate joint venture receipts Proceeds on dispositions Other Cash used by investing activities Financing Activities Dividends paid to holders of Common Shares Treasury shares acquired Issue (repayment) of short-term borrowings, net Long-term debt issued Redemptions and repayment of long-term debt Issue of shares by subsidiary to non-controlling interests Other Cash used by financing activities Cash Position Increase (decrease in cash and temporary investments, net Cash and temporary investments, net, beginning of period Cash and temporary investments, net, end of period Supplemental Disclosure of Operating Cash Flows Interest paid Interest received 31(b) 13(a) (1,082) (1,141) (100) (67) 5,500 (5,377) 24 26 6,367 26 (5,502) (1) 31(a) (15) (1,176) (9) (227) (95) 77 509 432 $ 509 $ 414 $ (539) $ (608) $ 9 $ 7 $ (197) $ (191) Income taxes paid, net The accompanying notes are an integral part of these consolidated financial statements. 124. TELUS 2018 ANNUAL REPORT CONSOLIDATED FINANCIAL STATEMENTS