

Answered step by step
Verified Expert Solution
Question
1 Approved Answer
you can look up the information on Targets SEC filings. I am needing help finding that information too. Use Target's 2017 annual report filed with
you can look up the information on Targets SEC filings. I am needing help finding that information too.
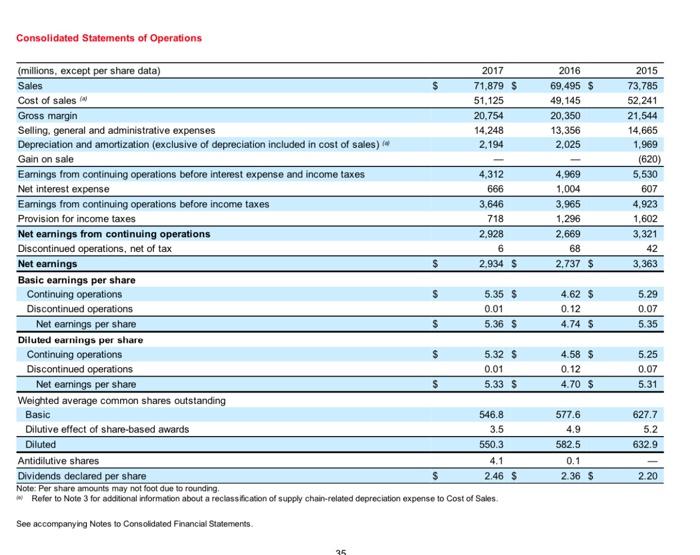
Use Target's 2017 annual report filed with the SEC in 2018 for the following calculations. Also, refer to Note 30 for information about the assets associated with discontinued operations For the most recent year presented, what was Target's return on assets for continuing operations? In other words, exclude the effects of discontinued operations from the numerator and denominator Do NOT round intermediate calculations. Only round final answers Epress your answer as a percentage, but do NOT include a percent sign Round your final answer to 3 decimal places (for example: 1123) Fin the blank Consolidated Statements of Operations $ 2016 69,495 $ 49,145 20,350 13,356 2,025 2015 73.785 52.241 21,544 14,665 1.969 (620) 5,530 607 4,923 1,602 3.321 42 3.363 4,969 1,004 3,965 1,296 2,669 68 2,737 $ 6 $ (millions, except per share data) 2017 Sales 71,879 $ Cost of sales 51,125 Gross margin 20.754 Selling, general and administrative expenses 14.248 Depreciation and amortization (exclusive of depreciation included in cost of sales) 2,194 Gain on sale Earnings from continuing operations before interest expense and income taxes 4,312 Net interest expense 666 Earnings from continuing operations before income taxes 3,646 Provision for income taxes 718 Net earnings from continuing operations 2,928 Discontinued operations, net of tax Net earnings 2.934 $ Basic earnings per share Continuing operations 5.35 $ Discontinued operations 0.01 Net earnings per share 5.36 $ Diluted earnings per share Continuing operations $ 5.32 $ Discontinued operations 0.01 Net earnings per share $ 5.33 $ Weighted average common shares outstanding Basic 546.8 Dilutive effect of share-based awards 3.5 Diluted 550.3 Antidilutive shares 4.1 Dividends declared per share 2.46 $ Note: Per share amounts may not foot due to rounding # Refer to Note 3 for additional information about a reclassification of supply chain-related depreciation expense to Cost of Sales See accompanying Notes to Consolidated Financial Statements. $ 4.62 $ 0.12 4.74 $ 5.29 0.07 5.35 $ 4.58 $ 0.12 4.70 $ 5.25 0.07 5.31 577.6 4.9 582.5 0.1 2.36 $ 627.7 5.2 632.9 $ 2.20 25 Use Target's 2017 annual report filed with the SEC in 2018 for the following calculations. Also, refer to Note 30 for information about the assets associated with discontinued operations For the most recent year presented, what was Target's return on assets for continuing operations? In other words, exclude the effects of discontinued operations from the numerator and denominator Do NOT round intermediate calculations. Only round final answers Epress your answer as a percentage, but do NOT include a percent sign Round your final answer to 3 decimal places (for example: 1123) Fin the blank Consolidated Statements of Operations $ 2016 69,495 $ 49,145 20,350 13,356 2,025 2015 73.785 52.241 21,544 14,665 1.969 (620) 5,530 607 4,923 1,602 3.321 42 3.363 4,969 1,004 3,965 1,296 2,669 68 2,737 $ 6 $ (millions, except per share data) 2017 Sales 71,879 $ Cost of sales 51,125 Gross margin 20.754 Selling, general and administrative expenses 14.248 Depreciation and amortization (exclusive of depreciation included in cost of sales) 2,194 Gain on sale Earnings from continuing operations before interest expense and income taxes 4,312 Net interest expense 666 Earnings from continuing operations before income taxes 3,646 Provision for income taxes 718 Net earnings from continuing operations 2,928 Discontinued operations, net of tax Net earnings 2.934 $ Basic earnings per share Continuing operations 5.35 $ Discontinued operations 0.01 Net earnings per share 5.36 $ Diluted earnings per share Continuing operations $ 5.32 $ Discontinued operations 0.01 Net earnings per share $ 5.33 $ Weighted average common shares outstanding Basic 546.8 Dilutive effect of share-based awards 3.5 Diluted 550.3 Antidilutive shares 4.1 Dividends declared per share 2.46 $ Note: Per share amounts may not foot due to rounding # Refer to Note 3 for additional information about a reclassification of supply chain-related depreciation expense to Cost of Sales See accompanying Notes to Consolidated Financial Statements. $ 4.62 $ 0.12 4.74 $ 5.29 0.07 5.35 $ 4.58 $ 0.12 4.70 $ 5.25 0.07 5.31 577.6 4.9 582.5 0.1 2.36 $ 627.7 5.2 632.9 $ 2.20 25 Step by Step Solution
There are 3 Steps involved in it
Step: 1

Get Instant Access to Expert-Tailored Solutions
See step-by-step solutions with expert insights and AI powered tools for academic success
Step: 2

Step: 3
Ace Your Homework with AI
Get the answers you need in no time with our AI-driven, step-by-step assistance
Get Started
Provider Audit In England Evaluating Medical Audit
Authors: James Buttery, Yvette; Walshe, Kieran; Rumsey, Moira; Amess, Moyra; Bennett, Jennifer & Coles
1st Edition
1898845034, 978-1898845034