

Answered step by step
Verified Expert Solution
Question
1 Approved Answer
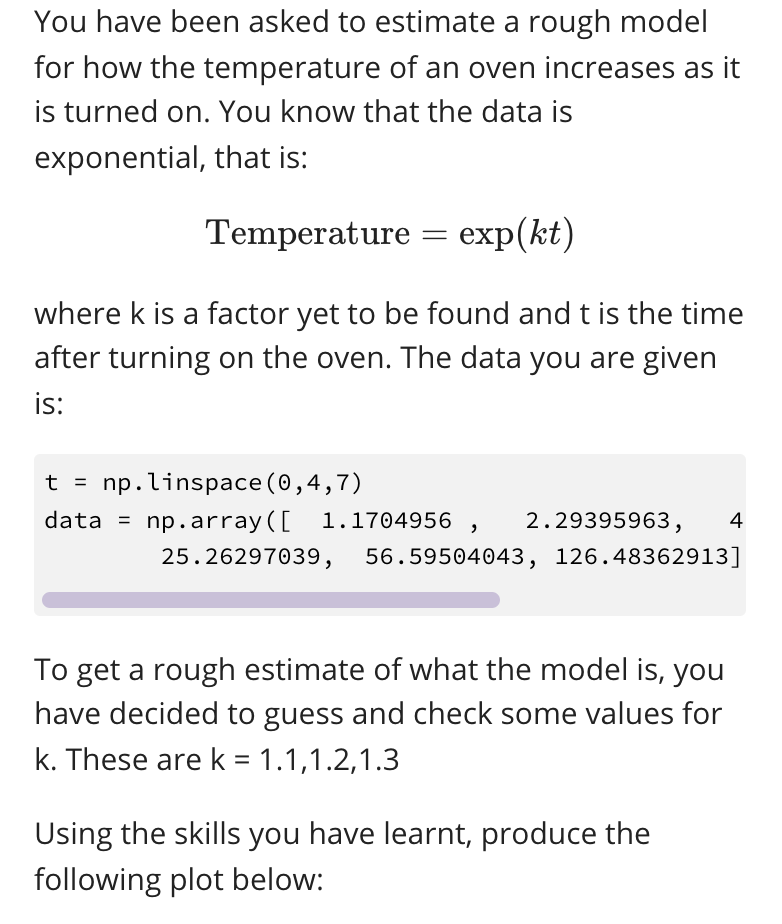
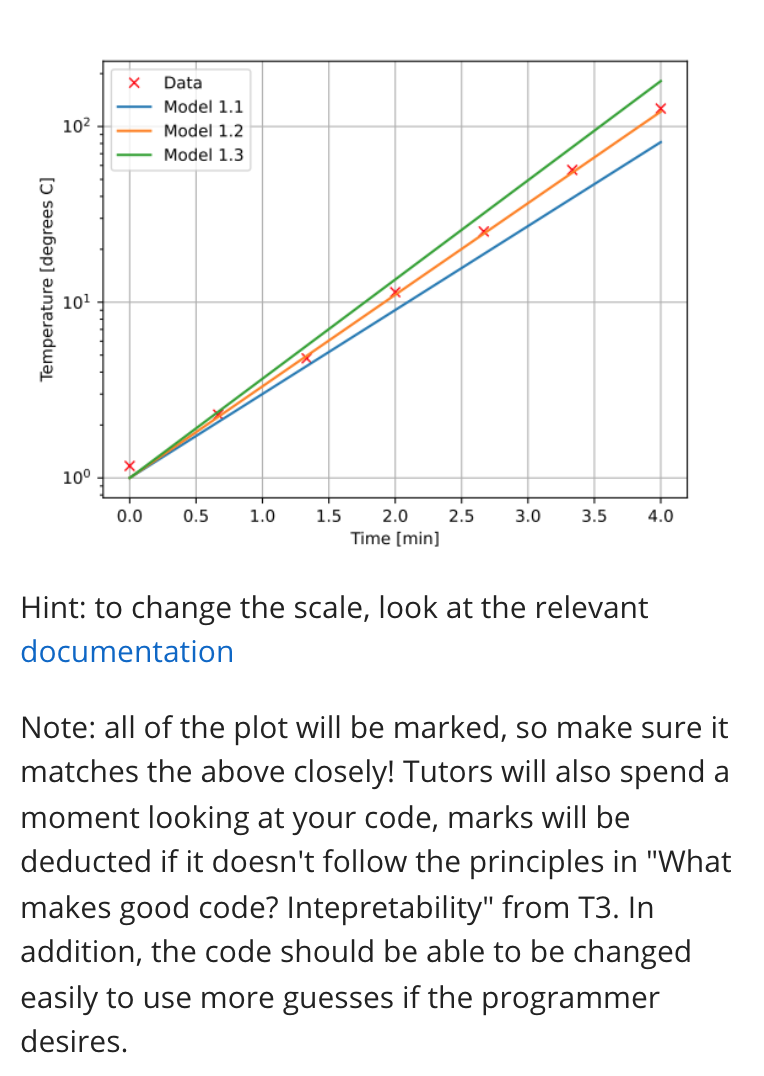
You have been asked to estimate a rough model for how the temperature of an oven increases as it is turned on. You know that
Step by Step Solution
There are 3 Steps involved in it
Step: 1

Get Instant Access to Expert-Tailored Solutions
See step-by-step solutions with expert insights and AI powered tools for academic success
Step: 2

Step: 3
Ace Your Homework with AI
Get the answers you need in no time with our AI-driven, step-by-step assistance
Get Started
AutoCAD Database Connectivity
Authors: Scott McFarlane
1st Edition
0766816400, 978-0766816404