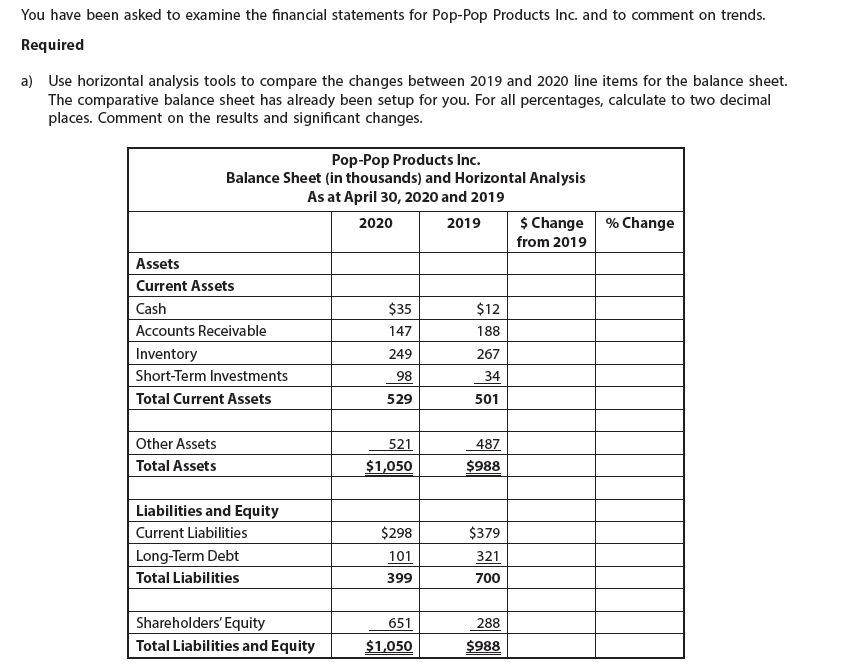
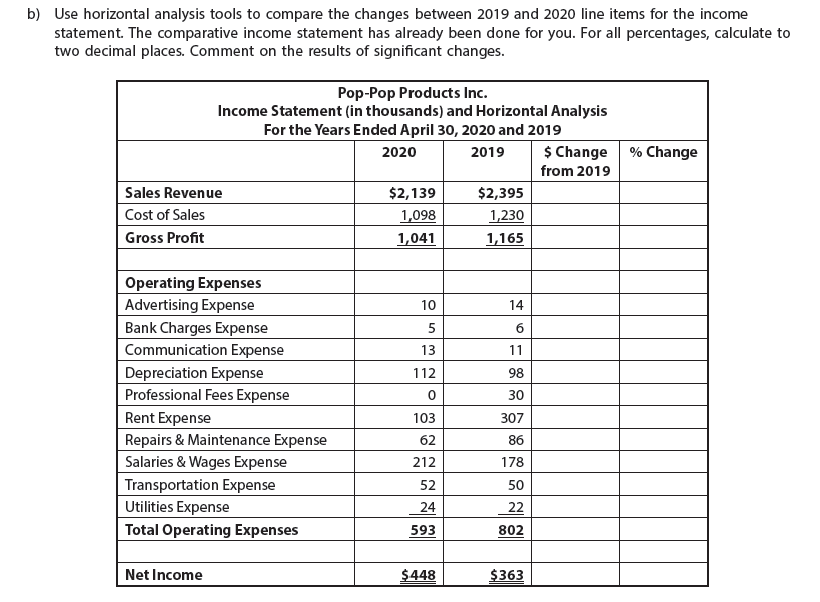
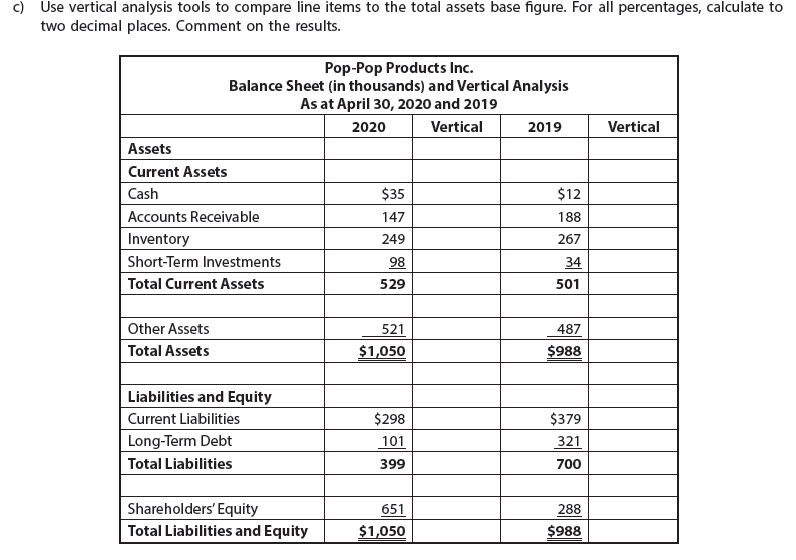
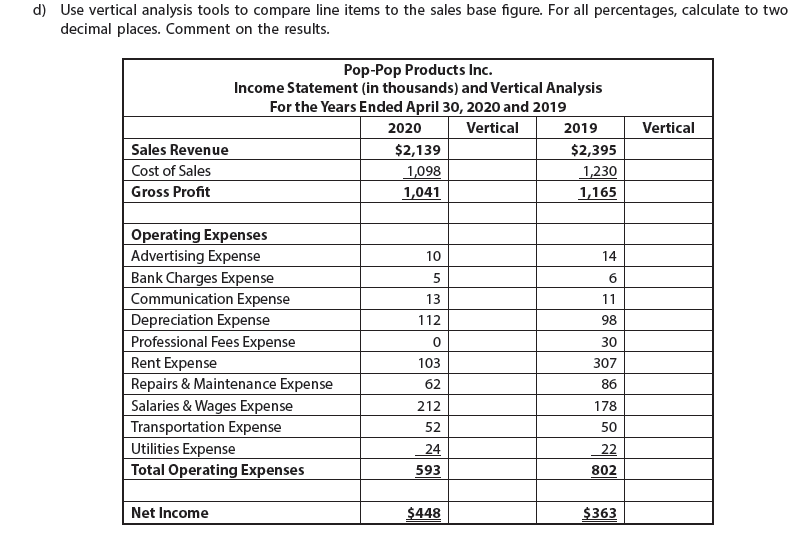
You have been asked to examine the financial statements for Pop-Pop Products Inc. and to comment on trends. Required a) Use horizontal analysis tools to compare the changes between 2019 and 2020 line items for the balance sheet. The comparative balance sheet has already been setup for you. For all percentages, calculate to two decimal places. Comment on the results and significant changes. % Change Pop-Pop Products Inc. Balance Sheet (in thousands) and Horizontal Analysis As at April 30, 2020 and 2019 2020 2019 $ Change from 2019 Assets Current Assets Cash $35 $12 Accounts Receivable 147 188 Inventory 249 267 Short-Term Investments 34 Total Current Assets 529 501 98 Other Assets Total Assets 521 $1,050 487 $988 Liabilities and Equity Current Liabilities Long-Term Debt Total Liabilities $298 101 399 $379 321 700 288 Shareholders' Equity Total Liabilities and Equity 651 $1,050 $988 b) Use horizontal analysis tools to compare the changes between 2019 and 2020 line items for the income statement. The comparative income statement has already been done for you. For all percentages, calculate to two decimal places. Comment on the results of significant changes. % Change Pop-Pop Products Inc. Income Statement (in thousands) and Horizontal Analysis For the Years Ended April 30, 2020 and 2019 2020 2019 $ Change from 2019 Sales Revenue $2,139 $2,395 Cost of Sales 1,098 1,230 Gross Profit 1,041 1,165 10 14 6 5 13 112 11 98 0 30 Operating Expenses Advertising Expense Bank Charges Expense Communication Expense Depreciation Expense Professional Fees Expense Rent Expense Repairs & Maintenance Expense Salaries & Wages Expense Transportation Expense Utilities Expense Total Operating Expenses 307 86 178 103 62 212 52 24 593 50 22 802 Net Income $448 $363 c) Use vertical analysis tools to compare line items to the total assets base figure. For all percentages, calculate to two decimal places. Comment on the results. Vertical Pop-Pop Products Inc. Balance Sheet (in thousands) and Vertical Analysis As at April 30, 2020 and 2019 2020 Vertical 2019 Assets Current Assets Cash $35 $12 Accounts Receivable 147 188 Inventory 249 267 Short-Term Investments 98 Total Current Assets 529 501 34 Other Assets Total Assets 521 $1,050 487 $988 Liabilities and Equity Current Liabilities Long-Term Debt Total Liabilities $298 101 399 $379 321 700 288 Shareholders' Equity Total Liabilities and Equity 651 $1,050 $988 d) Use vertical analysis tools to compare line items to the sales base figure. For all percentages, calculate to two decimal places. Comment on the results. Pop-Pop Products Inc. Income Statement (in thousands) and Vertical Analysis For the Years Ended April 30, 2020 and 2019 2020 Vertical 2019 Sales Revenue $2,139 $2,395 Cost of Sales 1,098 1,230 Gross Profit 1,041 1,165 Vertical 10 14 5 13 112 6 11 98 0 Operating Expenses Advertising Expense Bank Charges Expense Communication Expense Depreciation Expense Professional Fees Expense Rent Expense Repairs & Maintenance Expense Salaries & Wages Expense Transportation Expense Utilities Expense Total Operating Expenses 103 62 212 52 24 593 30 307 86 178 50 22 802 Net Income $448 $363 You have been asked to examine the financial statements for Pop-Pop Products Inc. and to comment on trends. Required a) Use horizontal analysis tools to compare the changes between 2019 and 2020 line items for the balance sheet. The comparative balance sheet has already been setup for you. For all percentages, calculate to two decimal places. Comment on the results and significant changes. % Change Pop-Pop Products Inc. Balance Sheet (in thousands) and Horizontal Analysis As at April 30, 2020 and 2019 2020 2019 $ Change from 2019 Assets Current Assets Cash $35 $12 Accounts Receivable 147 188 Inventory 249 267 Short-Term Investments 34 Total Current Assets 529 501 98 Other Assets Total Assets 521 $1,050 487 $988 Liabilities and Equity Current Liabilities Long-Term Debt Total Liabilities $298 101 399 $379 321 700 288 Shareholders' Equity Total Liabilities and Equity 651 $1,050 $988 b) Use horizontal analysis tools to compare the changes between 2019 and 2020 line items for the income statement. The comparative income statement has already been done for you. For all percentages, calculate to two decimal places. Comment on the results of significant changes. % Change Pop-Pop Products Inc. Income Statement (in thousands) and Horizontal Analysis For the Years Ended April 30, 2020 and 2019 2020 2019 $ Change from 2019 Sales Revenue $2,139 $2,395 Cost of Sales 1,098 1,230 Gross Profit 1,041 1,165 10 14 6 5 13 112 11 98 0 30 Operating Expenses Advertising Expense Bank Charges Expense Communication Expense Depreciation Expense Professional Fees Expense Rent Expense Repairs & Maintenance Expense Salaries & Wages Expense Transportation Expense Utilities Expense Total Operating Expenses 307 86 178 103 62 212 52 24 593 50 22 802 Net Income $448 $363 c) Use vertical analysis tools to compare line items to the total assets base figure. For all percentages, calculate to two decimal places. Comment on the results. Vertical Pop-Pop Products Inc. Balance Sheet (in thousands) and Vertical Analysis As at April 30, 2020 and 2019 2020 Vertical 2019 Assets Current Assets Cash $35 $12 Accounts Receivable 147 188 Inventory 249 267 Short-Term Investments 98 Total Current Assets 529 501 34 Other Assets Total Assets 521 $1,050 487 $988 Liabilities and Equity Current Liabilities Long-Term Debt Total Liabilities $298 101 399 $379 321 700 288 Shareholders' Equity Total Liabilities and Equity 651 $1,050 $988 d) Use vertical analysis tools to compare line items to the sales base figure. For all percentages, calculate to two decimal places. Comment on the results. Pop-Pop Products Inc. Income Statement (in thousands) and Vertical Analysis For the Years Ended April 30, 2020 and 2019 2020 Vertical 2019 Sales Revenue $2,139 $2,395 Cost of Sales 1,098 1,230 Gross Profit 1,041 1,165 Vertical 10 14 5 13 112 6 11 98 0 Operating Expenses Advertising Expense Bank Charges Expense Communication Expense Depreciation Expense Professional Fees Expense Rent Expense Repairs & Maintenance Expense Salaries & Wages Expense Transportation Expense Utilities Expense Total Operating Expenses 103 62 212 52 24 593 30 307 86 178 50 22 802 Net Income $448 $363